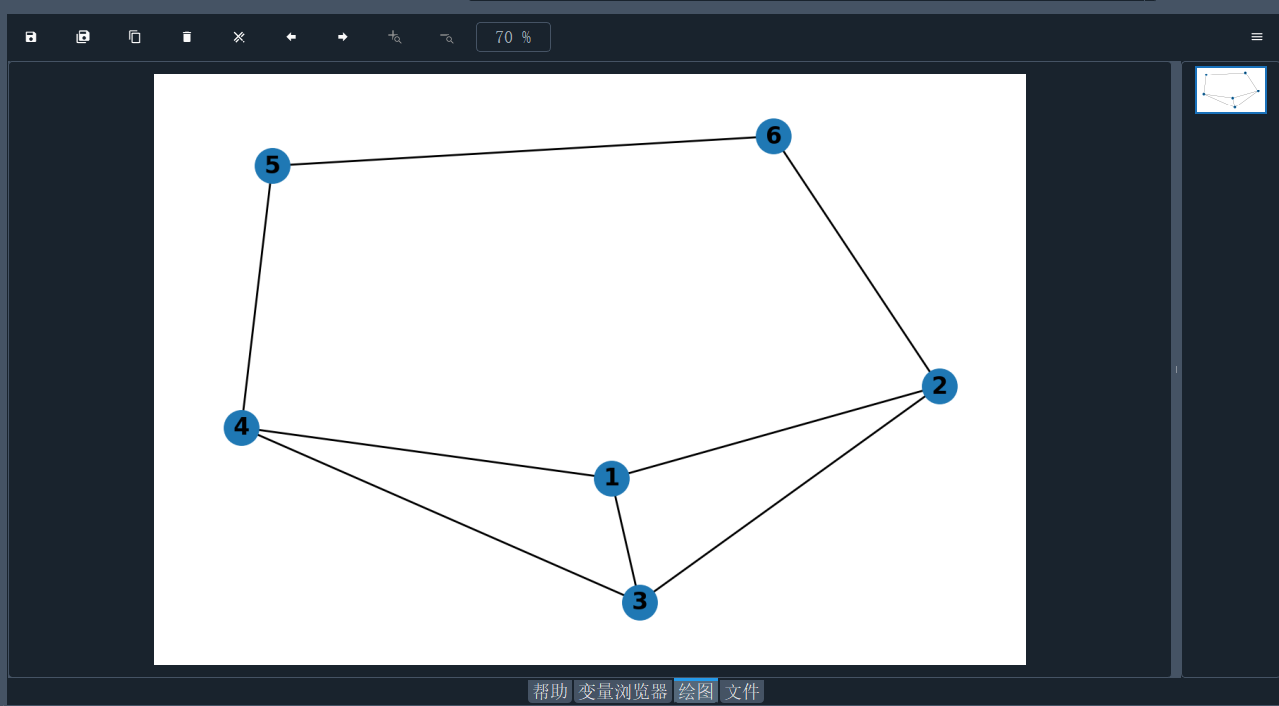
- 程式碼
點選檢視程式碼
import networkx as nx
import matplotlib.pyplot as plt
#建立一個無向圖
G=nx.Graph()
#新增節點
G.add_nodes_from([1,2,3,4,5,6])
#新增邊
edges=[(1,2),(1,3),(1,4),(2,3),(2,6),(3,4),(4,5),(5,6)]
G.add_edges_from(edges)
#使用預設佈局演算法繪製圖
pos=nx.spring_layout(G)
#繪製圖,其中with_labels=True 表示顯示節點標籤,font_weightt='bold'表示節點標籤加粗顯示
nx.draw(G,pos,with_labels=True,font_weight='bold')
plt.show()