Percona XtraDB cluster的學習與實踐。
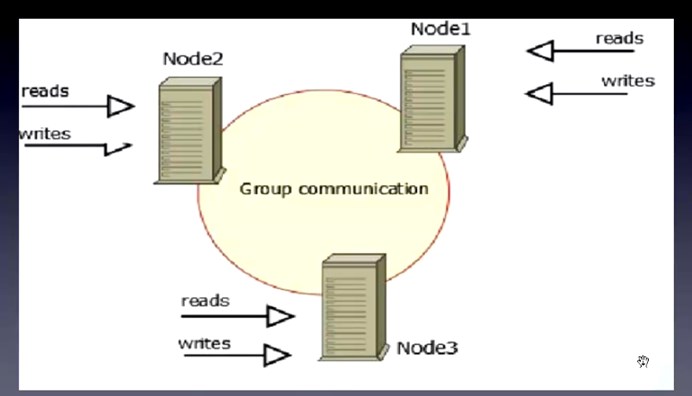
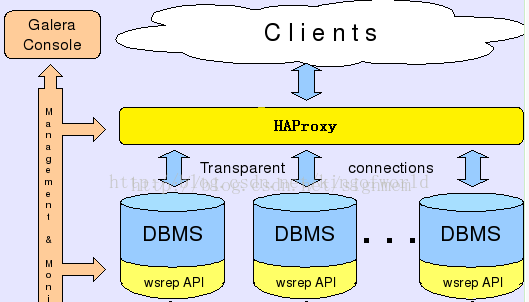
最近,本人根據度娘,學習了mysql的一種高可用和負載均衡方案——percona xtradb cluster(簡稱pxc),這是一種同步的複製方案,每個節點都可以讀寫,並且寫一份資料,其他節點會同時擁有。在 XtraDB Cluster 中,沒有主從的概念。
缺點及限制:
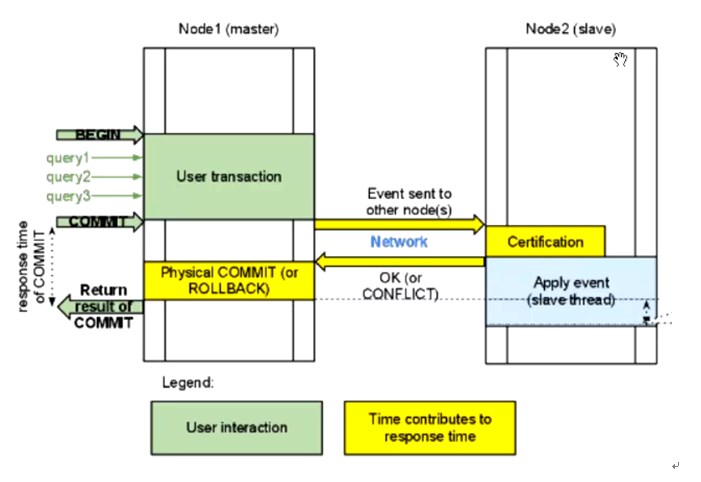
由於同一個事務需要在叢集的多臺機器上執行,因此網路傳輸及併發執行會導致效能上有一定的消耗。所有機器上都儲存著相同的資料,全冗餘。若一臺機器既作為主伺服器,又作為備份伺服器,出現樂觀鎖導致rollback的機率會增大,編寫程式時要小心。不支援的SQL:LOCK / UNLOCK TABLES / GET_LOCK(), RELEASE_LOCK()…不支援XA Transaction目前基於Galera Cluster的實現方案有三種:Galera Cluster for MySQL、Percona XtraDB Cluster、MariaDB Galera Cluster。
我們採用較成熟、應用案例較多的Percona XtraDB Cluster。
下面就一起來安裝體驗一下吧。
機器:分配
db_01:10.72.16.116:3306、 db_02:10.72.16.117:3306、db_03:10.72.16.118:3307
haproxy:10.72.16.118:3306
一、安裝包準備
wget
wget
二、刪除原有軟體包
不刪除會衝突,安裝不上。
rpm -qa | grep -i mysql | xargs sudo rpm -e --nodeps
三、安裝
1、安裝percona-xtrabackup
yum -y install perl-DBD-MySQL
yum -y install perl-Time-HiRes
rpm -ivh percona-xtrabackup-2.2.12-1.el6.x86_64.rpm
2、安裝Percona-XtraDB-Cluster-galera
rpm -ivh Percona-XtraDB-Cluster-galera-2-2.12-1.2682.rhel6.x86_64.rpm
rpm -ivh Percona-XtraDB-Cluster-galera-2-debuginfo-2.12-1.2682.rhel6.x86_64.rpm
3、安裝Percona-XtraDB-Cluster-client
[root@localhost soft]# rpm -ivh Percona-XtraDB-Cluster-client-55-5.5.41-25.11.853.el6.x86_64.rpm
4、安裝Percona-XtraDB-Cluster-server
[root@localhost soft]# rpm -ivh socat-1.7.2.4-1.el6.rf.x86_64.rpm
warning: socat-1.7.2.4-1.el6.rf.x86_64.rpm: Header V3 DSA/SHA1 Signature, key ID 6b8d79e6: NOKEY
Preparing... ########################################### [100%]
1:socat ########################################### [100%]
[root@localhost soft]# rpm -ivh Percona-XtraDB-Cluster-server-55-5.5.41-25.11.853.el6.x86_64.rpm
warning: Percona-XtraDB-Cluster-server-55-5.5.41-25.11.853.el6.x86_64.rpm: Header V4 DSA/SHA1 Signature, key ID cd2efd2a: NOKEY
Preparing... ########################################### [100%]
1:Percona-XtraDB-Cluster-########################################### [100%]
/var/tmp/rpm-tmp.etTgDS: line 101: x0: command not found
Percona XtraDB Cluster is distributed with several useful UDFs from Percona Toolkit.
Run the following commands to create these functions:
mysql -e "CREATE FUNCTION fnv1a_64 RETURNS INTEGER SONAME 'libfnv1a_udf.so'"
mysql -e "CREATE FUNCTION fnv_64 RETURNS INTEGER SONAME 'libfnv_udf.so'"
mysql -e "CREATE FUNCTION murmur_hash RETURNS INTEGER SONAME 'libmurmur_udf.so'"
See for more details
這時候就安裝了一個percona的mysql,不是原生的mysql。
四、修改my.cnf
find / -name 'my-default.cnf'
cp my-default.cnf /etc/my.cnf
10.72.16.116 機器的配置:
vi /etc/my.cnf
[mysqld]
#datadir=/var/lib/mysql
datadir=/data/mysql
socket=/var/lib/mysql/mysql.sock
user=mysql
port=3306
#default-storage-engine=INNODB
#skip-grant-table
# Default to using old password format for compatibility with mysql 3.x
# clients (those using the mysqlclient10 compatibility package).
# Disabling symbolic-links is recommended to prevent assorted security risks;
# to do so, uncomment this line:
# symbolic-links=0
#skip-grant-tables
#replicate-do-db=db1
##############第一個節點新增如下部分###############
server_id=116 #修改此項和節點一不同
wsrep_provider=/usr/lib64/libgalera_smm.so
wsrep_cluster_address=gcomm://10.72.16.116,10.72.16.117,10.72.16.118 #Cluster叢集中的所有節點IP,不用寫埠,非預設埠也不用寫
wsrep_node_address = 10.72.16.116 #Cluster叢集當前節點的IP
wsrep_sst_auth=sstuser:secret
#wsrep_provider_options="gcache.size = 1G;debug = yes"
wsrep_provider_options="gcache.size=1G"
wsrep_cluster_name=pxc_taotao #Cluster 叢集的名字
#wsrep_sst_method=xtrabackup
#wsrep_sst_method = rsync #很大,上T用這個
wsrep_sst_method = xtrabackup-v2 #100-200G用
wsrep_node_name=db_01 #修改此項和節點一不同
wsrep_slave_threads=4
innodb_locks_unsafe_for_binlog=1
innodb_autoinc_lock_mode=2
#wsrep_sst_donor = #從那個節點主機名同步資料
####################
[mysqld_safe]
log-error=/var/log/mysqld.log
pid-file=/var/run/mysqld/mysqld.pid
~~~~~~~~~~~~~~~~~~~
10.72.16.117的/etc/my.cnf
[mysqld]
#datadir=/var/lib/mysql
datadir=/data/mysql
#socket=/var/lib/mysql/mysql.sock
user=mysql
#port=3306
#default-storage-engine=INNODB
#skip-grant-table
# Default to using old password format for compatibility with mysql 3.x
# clients (those using the mysqlclient10 compatibility package).
# Disabling symbolic-links is recommended to prevent assorted security risks;
# to do so, uncomment this line:
# symbolic-links=0
#skip-grant-tables
#replicate-do-db=db1
##############
server_id=117 #修改此項和節點一不同
wsrep_provider=/usr/lib64/libgalera_smm.so
wsrep_cluster_address=gcomm://10.72.16.116,10.72.16.117,10.72.16.118 #Cluster叢集中的所有節點IP,不用寫埠,非預設埠也不用寫
wsrep_node_address = 10.72.16.117 #Cluster叢集當前節點的IP
wsrep_sst_auth=sstuser:secret
#wsrep_provider_options="gcache.size = 1G;debug = yes"
wsrep_provider_options="gcache.size=1G"
wsrep_cluster_name=pxc_taotao #Cluster 叢集的名字
#wsrep_sst_method=xtrabackup
#wsrep_sst_method = rsync #很大,上T用這個
wsrep_sst_method = xtrabackup-v2 #100-200G用
wsrep_node_name=db_02 #修改此項和節點一不同
wsrep_slave_threads=4
innodb_locks_unsafe_for_binlog=1
innodb_autoinc_lock_mode=2
#wsrep_sst_donor = #從那個節點主機名同步資料
###################
[mysqld_safe]
log-error=/var/log/mysqld.log
pid-file=/var/run/mysqld/mysqld.pid
10.72.16.118的my.cnf
[mysqld]
datadir=/var/lib/mysql
socket=/var/lib/mysql/mysql.sock
user=mysql
port=3307
# Disabling symbolic-links is recommended to prevent assorted security risks
symbolic-links=0
######################新增如下部分###########
server_id=118 #修改此項和節點一不同
wsrep_provider=/usr/lib64/libgalera_smm.so
wsrep_cluster_address=gcomm://10.72.16.116,10.72.16.117,10.72.16.118 #Cluster叢集中的所有節點IP,不用寫埠,非預設埠也不用寫
wsrep_node_address = 10.72.16.118 #Cluster叢集當前節點的IP
wsrep_sst_auth=sstuser:secret
#wsrep_provider_options="gcache.size = 1G;debug = yes"
wsrep_provider_options="gcache.size=1G"
wsrep_cluster_name=pxc_taotao #Cluster 叢集的名字
#wsrep_sst_method=xtrabackup
#wsrep_sst_method = rsync #很大,上T用這個
wsrep_sst_method = xtrabackup-v2 #100-200G用
wsrep_node_name=db_03 #修改此項和節點一不同
wsrep_slave_threads=4
innodb_locks_unsafe_for_binlog=1
innodb_autoinc_lock_mode=2
#wsrep_sst_donor = #從那個節點主機名同步資料
#############################
[mysqld_safe]
log-error=/var/log/mysqld.log
pid-file=/var/run/mysqld/mysqld.pid
注:第二個節點10.72.16.117和第三個節點10.72.16.118的my.cnf配置檔案只需修改如下三個引數即可:
wsrep_node_address 引數為Cluster叢集節點的當前機器的IP地址
server-id 的標識
wsrep_node_name=db_03 #修改此項和節點一不同,並非是主機名
五、然後在10.72.16.116機器上(第一個節點)初始化資料庫:
# mysql_install_db --user=mysql --basedir=/usr --datadir=/data/mysql
六、啟動叢集的第一個節點(10.72.16.116)
# service mysql bootstrap-pxc --wsrep-cluster-address="gcomm://"
如果iptables和selinux沒有關閉,此處會啟動失敗。以上述方式啟動完第一個節點後,用命令service mysql start依次啟動第二和第三個節點。當全部節點啟動完畢後,再回過來把第一個節點ervice myslq restart重新啟動。這是因為在叢集節點全部關閉狀態下,第一個啟動的節點必須以gcomm://方式啟動。
參考:
七、配置備份使用者
第一個節點啟動後,在啟動第二個節點之前需要配置備份使用者,否則第二個節點無法啟動。因為第二個節點透過xtrabackup進行拉資料,需要透過配置檔案中的sstuser使用者。
mysql> Grant all privileges on *.* to 'sstuser'@'%' identified by 'secret' with grant option;
mysql> flush privileges;
驗證sstuser是否可以本地登入
# mysql -usstuser -psecret
如果無法登入,增加:
mysql> Grant all privileges on *.* to 'sstuser'@'localhost' identified by 'secret' with grant option;
mysql> flush privileges;
八、其它節點
其它節點無需初始化資料庫,只需要service mysql start,資料會透過xbackup從第一個節點上拉過來。
不過,筆者在啟動第二個節點10.72.16.117mysql服務報錯,檢視了本地/var/log/mysqld.log的日誌錯誤,一直不知所云。
最後,筆者在啟動第二個節點mysql服務時,去第一個節點10.72.16.116觀察日誌,發現瞭如下這樣的錯誤:
WSREP_SST: [ERROR] innobackupex finished with error: 1. Check /data/mysql//innobackup.backup.log (20150926 22:38:20.148)
WSREP_SST: [ERROR] Cleanup after exit with status:22 (20150926 22:38:20.154)
趕緊到第一個節點的/data/mysql//innobackup.backup.log看錯誤,如下:
ERROR: Failed to connect to MySQL server as DBD::mysql module is not installed at /usr/bin/innobackupex line 1397
檢視百度,大多數都是說安裝 yum -y install perl-DBD-MySQL就好了,可我明明是安裝的呀。最後安裝這篇部落格的方法試了一下,結果成功了:
解決方法是這樣的,就是重灌一下perl-DBD-MySQL,再第二個節點10.72.16.117重啟mysql服務就好了。
具體解決方法:
rpm -qa |grep -i dbd
rpm -qa |grep -i dbi
查詢出來後執行:
rpm -e –nodeps perl-DBD-MySQL
rpm -e –nodeps perl-DBI
然後執行:
yum install -y perl-DBD-MySQL 即可
最後我們可以透過MySQL Status來看看是否有建立成功。
mysql> show global status like 'wsrep_cluster_size';
+--------------------+-------+
| Variable_name      | Value |
+--------------------+-------+
| wsrep_cluster_size | 3     |
+--------------------+-------+
1 row in set (0.00 sec)
看到wsrep_cluster_size出現正確的Server數量,就代表設定成功。
九、pxc叢集節點啟動順序
當pxc環境搭建好了後,如果將來有一天這個叢集裡面的三個節點全部當機了,那麼如果啟動第一個節點時以service mysql start方式是有問題的。啟動第一個節點(任何節點都可以做為第一節點)正確的做法如下:
參考:
十、haproxy的安裝
1、軟體下載地址
如果你打不開這個網站,可能得需要翻牆才能下載,我就翻牆才下載的。
tar -xvf haproxy-1.5.14.tar.gz
cd haproxy-1.5.14
make TARGET=linux26 PREFIX=/usr/local/haproxy
make install PREFIX=/usr/local/haproxy
十一、建立haproxy配置檔案
haproxy 預設是沒有配置檔案的,需要自己手機建立
mkdir /usr/local/haproxy/etc
- [root@localhost etc]# cat /usr/local/haproxy/etc/haproxy.cfg
- # this config needs haproxy-1.1.28 or haproxy-1.2.1
- global #全域性引數
- log 127.0.0.1 local0 #定義日誌輸出到哪裡,以及日誌級別,格式log <address> <facility> [max level [min level]],使用ip地址,預設使用udp 514埠,可以配置兩種日誌,一種程式啟動和退出,一種代理日誌
- log 127.0.0.1 local1 notice
- maxconn 4096 #每個程式的最大併發連線數
- #ulimit-n 10240 #每個程式的檔案描述符,預設根據maxconn值自動計算
- # chroot /usr/share/haproxy #安全目錄,需要root許可權啟動haproxy
- uid 99 #程式的使用者ID,必須使用root使用者執行,交換到指定的使用者,也可以使用user
- gid 99 #程式的組ID,也可以使用group指定組名
- daemon #後臺執行,等同於命令列引數-D
- #nbproc 2 多程式模式,預設只開啟一個程式
- pidfile /var/run/haproxy/haproxy.pid
- #stats socket /var/run/haproxy/haproxy.sock level operator #能接收各種狀態輸出,以及能接收命令輸入
- #debug
- #quiet
- defaults
- log global #使用global段的日誌定義
- mode http #設定例項執行模式或協議,支援http、tcp和health,frontend和backend要一致
- option tcplog #啟用記錄tcp連線的日誌,包含會話狀態和時間,連線數,frontend、backend和server name,源地址和埠,當使用tcp模式時能找出客戶端、伺服器斷開連線或超時。
- option dontlognull #不記錄來自監控狀態檢查的空連線
- retries 3 #連線錯誤後,重傳次數
- option redispatch #連線錯誤,啟用會話重新分配
- maxconn 2000
- timeout connect 5000 #單位為毫秒,等待成功連線到伺服器的最大時間值
- timeout client 50000 #設定在客戶端側的最大不活躍時間值,在TCP模式,最好跟伺服器側一致
- timeout server 50000 #設定在服務端側的最大不活躍時間值,
- frontend pxc-front #描述允許客戶端連線的監聽套接字
- bind *:3306 #這個表示前端再連線3306埠時,haproxy把請求均勻分配給後端的三個資料庫
- mode tcp
- default_backend pxc-back #當沒有匹配use_backend時,預設的backend
- frontend pxc-onenode-front
- bind *:3308 #這個表示前端再連線haproxy的3308埠時,就表示haproxy只把請求分配各一個機器10.72.16.116,當116機器down了後,才會自動連線第二個資料庫10.72.16.117
- mode tcp
- default_backend pxc-onenode-back
- frontend stats-front
- bind *:80
- mode http
- default_backend stats-back
- backend pxc-back #描述進來的連線將轉發到哪些後端伺服器
- mode tcp
- balance leastconn #負載均衡演算法,使用最少連線演算法,適合長連線應用
- option httpchk #啟用HTTP協議檢查伺服器監控狀態,透過呼叫指令碼檢查節點的狀態
- server mariadb01 10.72.16.116:3306 check port 9200 inter 12000 rise 3 fall 3 #fall連續3次檢查錯誤後,將表明伺服器死亡,預設為3;inter連續兩次檢查的間隔時間值,單位為毫秒,預設為2s;rise連續3次檢查成功,表明服務可用
- server mariadb02 10.72.16.117:3306 check port 9200 inter 12000 rise 3 fall 3
- server mariadb03 10.72.16.118:3307 check port 9200 inter 12000 rise 3 fall 3
- #option mysql-check user haproxy_check #使用Mysql健康檢查,不檢查資料庫和資料一致性,需要在mysql上建立相應的檢查帳戶
- #server mariadb01 10.0.60.104:3306 check
- #server mariadb02 10.0.60.105:3306 check
- #server mariadb03 10.0.60.106:3306 check
- backend pxc-onenode-back
- mode tcp
- balance leastconn
- option httpchk
- server mariadb01 10.72.16.116:3306 check port 9200 inter 12000 rise 3 fall 3
- server mariadb02 10.72.16.117:3306 check port 9200 inter 12000 rise 3 fall 3 backup
- server mariadb03 10.72.16.118:3307 check port 9200 inter 12000 rise 3 fall 3 backup
- backend stats-back #開啟haproxy的狀態頁面
- mode http
- balance roundrobin
- stats uri /haproxy/stats #定義訪問統計資訊的URI
- stats auth admin:admin #設定檢視統計資訊的使用者名稱和密碼
上面的配置中,如果想讓pxc的三個機器都讀寫,並且負載均衡,可以讓web連線haproxy的3306埠;如果怕pxc三個節點都寫資料造成資料不一致,可以讓web應用連線haproxy的3308埠,這樣就只連線第一個機器,只有當第一個機器down了後,才會連線第二個或第三個。
當然,你也可以在程式上把讀請求分配給haproxy的3306埠,這樣就可以用haproxy的3306埠做讀的負載均衡;而你讓web的寫請求連線haproxy的3308埠,這樣web寫機器只有一個。
十二、新增haproxy日誌
vi /etc/rsyslog.conf
新增:
local0.* /var/log/haproxy.log #和haproxy的配置檔案中定義的log level一致
修改vi /etc/rsyslog.conf
$ModLoad imudp #開啟這個引數
$UDPServerRun 514 #開啟這個引數
然後/etc/init.d/rsyslog restart
上面兩個標黃色的引數很重要,必須開啟,否則不轉發。
十三、啟動haproxy
service httpd stop //確保80埠沒被佔用
/usr/local/sbin/haproxy –f /usr/local/sbin/haproxy.cfg
停止服務:
#sudo killall haproxy
十四、在每個mysql叢集節點安裝mysql健康狀態檢查指令碼
1、複製指令碼,我rpm安裝的pxc,發現不用複製,相應目錄下自動就有這些指令碼。
1 2 3 | cd /opt/PXC/ cp bin/clustercheck /usr/bin/ cp xinetd.d/mysqlchk /etc/xinetd.d/ |
2、新增服務埠:
echo 'mysqlchk 9200/tcp # mysqlchk' >> /etc/services
3、安裝和啟動xinetd服務
4、建立mysql的檢查帳戶,如不使用預設使用者名稱和密碼,將需要修改指令碼/usr/bin/clustercheck
1 | grant process on *.* to 'clustercheckuser'@'localhost' identified by 'clustercheckpassword!'; |
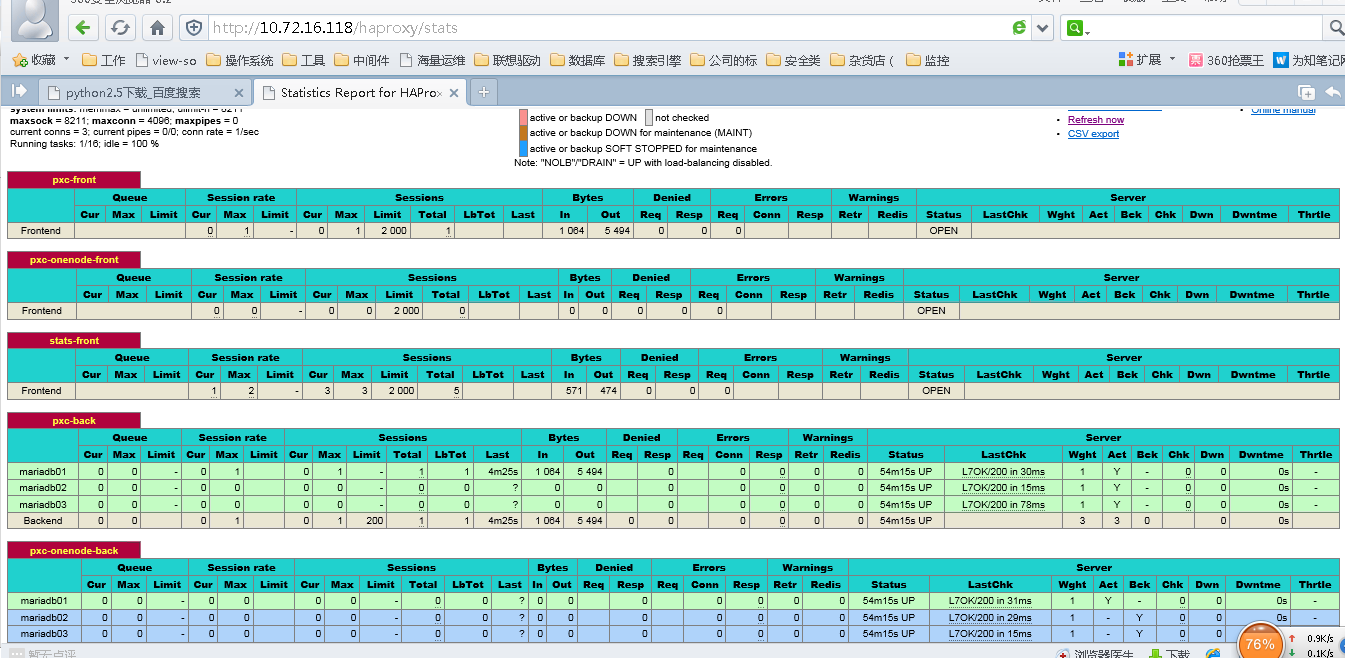
登入,使用者名稱和密碼是admin和admin,如果能看到如下圖,說明haproxy配置成功。
做完單節點的haproxy,你也可以用keepalved+haproxy防止haproxy單點故障,如果想用haproxy的話,請參考這個文件:http://www.cnblogs.com/taotaohappy/p/4694290.html
十五、測試
- [root@drbd-01 ~]# mysql -h10.72.16.118 -usysbench -psysbench -P3306
- Welcome to the MySQL monitor. Commands end with ; or \g.
- Your MySQL connection id is 17
- Server version: 5.5.41-37.0-55 Percona XtraDB Cluster (GPL), Release rel37.0, Revision 853, WSREP version 25.11, wsrep_25.11.r4027
- Copyright (c) 2009-2014 Percona LLC and/or its affiliates
- Copyright (c) 2000, 2014, Oracle and/or its affiliates. All rights reserved.
- Oracle is a registered trademark of Oracle Corporation and/or its
- affiliates. Other names may be trademarks of their respective
- owners.
- Type 'help;' or '\h' for help. Type '\c' to clear the current input statement.
- mysql> show variables like '%server_id%';
- +---------------+-------+
- | Variable_name | Value |
- +---------------+-------+
- | server_id | 116 |
- +---------------+-------+
- 1 row in set (0.01 sec)
- mysql> \q
- Bye
- [root@drbd-01 ~]# mysql -h10.72.16.118 -usysbench -psysbench -P3306
- Welcome to the MySQL monitor. Commands end with ; or \g.
- Your MySQL connection id is 25
- Server version: 5.5.41-37.0-55 Percona XtraDB Cluster (GPL), Release rel37.0, Revision 853, WSREP version 25.11, wsrep_25.11.r4027
- Copyright (c) 2009-2014 Percona LLC and/or its affiliates
- Copyright (c) 2000, 2014, Oracle and/or its affiliates. All rights reserved.
- Oracle is a registered trademark of Oracle Corporation and/or its
- affiliates. Other names may be trademarks of their respective
- owners.
- Type 'help;' or '\h' for help. Type '\c' to clear the current input statement.
- mysql> show variables like '%server_id%';
- +---------------+-------+
- | Variable_name | Value |
- +---------------+-------+
- | server_id | 117 |
- +---------------+-------+
- 1 row in set (0.00 sec)
- mysql> \q
- Bye
- [root@drbd-01 ~]# mysql -h10.72.16.118 -usysbench -psysbench -P3306
- Welcome to the MySQL monitor. Commands end with ; or \g.
- Your MySQL connection id is 955
- Server version: 5.5.41-37.0-55 Percona XtraDB Cluster (GPL), Release rel37.0, Revision 853, WSREP version 25.11, wsrep_25.11.r4027
- Copyright (c) 2009-2014 Percona LLC and/or its affiliates
- Copyright (c) 2000, 2014, Oracle and/or its affiliates. All rights reserved.
- Oracle is a registered trademark of Oracle Corporation and/or its
- affiliates. Other names may be trademarks of their respective
- owners.
- Type 'help;' or '\h' for help. Type '\c' to clear the current input statement.
- mysql> show variables like '%server_id%';
- +---------------+-------+
- | Variable_name | Value |
- +---------------+-------+
- | server_id | 118 |
- +---------------+-------+
- 1 row in set (0.00 sec)
1)下載sysbench
不知道為什麼,我在sourceforge.net已經找不到該軟體的下載地址了。就下載這個地址裡面的吧:。(我的網盤工具裡面有)
2) 安裝sysbench
tar -xvf sysbench-0.5.tar.gz
cd sysbench-0.5
./autogen.sh
./configure --prefix=/usr/local/sysbench --with-mysql-includes=/usr/include/mysql --with-mysql-libs=/usr/lib64/mysql
make && make install
3)找臺機器開始測試:
A、測試資料庫oltp
準備資料prepare
/usr/local/sysbench/bin/sysbench --這樣檢視sysbench的幫助
- [root@dg soft]# /usr/local/sysbench/bin/sysbench --mysql-host=10.72.16.118 --mysql-port=3306 --mysql-user=sysbench --mysql-password=sysbench --mysql-db=test --oltp-tables-count=2 --oltp-table-size=60000 --num-threads=50 --max-requests=100000000 --report-interval=1 --max-time=20 --test=/rman_backup/soft/sysbench-0.5/sysbench/tests/db/oltp.lua prepare
- sysbench 0.5: multi-threaded system evaluation benchmark
- Creating table 'sbtest1'...
- Inserting 60000 records into 'sbtest1'
- Creating table 'sbtest2'...
- Inserting 60000 records into 'sbtest2'
進行測試及結果分析
oltp進行壓測
- [root@dg soft]# /usr/local/sysbench/bin/sysbench --mysql-host=10.72.16.118 --mysql-port=3306 --mysql-user=sysbench --mysql-password=sysbench --mysql-db=test --oltp-tables-count=2 --oltp-table-size=60000 --num-threads=50 --max-requests=100000000 --report-interval=1 --max-time=20 --test=/rman_backup/soft/sysbench-0.5/sysbench/tests/db/oltp.lua run
- sysbench 0.5: multi-threaded system evaluation benchmark
- Running the test with following options:
- Number of threads: 50
- Report intermediate results every 1 second(s)
- Random number generator seed is 0 and will be ignored
- Threads started!
- [ 1s] threads: 50, tps: 34.97, reads/s: 1080.02, writes/s: 206.81
- [ 2s] threads: 50, tps: 93.01, reads/s: 1381.12, writes/s: 488.04
- [ 3s] threads: 50, tps: 97.02, reads/s: 1368.29, writes/s: 381.08
- [ 4s] threads: 50, tps: 139.02, reads/s: 1836.27, writes/s: 500.07
- [ 5s] threads: 50, tps: 210.03, reads/s: 2734.37, writes/s: 775.11
- [ 6s] threads: 50, tps: 66.51, reads/s: 1080.38, writes/s: 232.80
- [ 7s] threads: 50, tps: 40.95, reads/s: 354.58, writes/s: 160.81
- [ 8s] threads: 50, tps: 10.46, reads/s: 384.95, writes/s: 59.63
- [ 9s] threads: 50, tps: 46.78, reads/s: 598.16, writes/s: 164.22
- [ 10s] threads: 50, tps: 67.09, reads/s: 896.15, writes/s: 288.37
- [ 11s] threads: 50, tps: 41.53, reads/s: 597.66, writes/s: 165.12
- [ 12s] threads: 50, tps: 77.94, reads/s: 1049.16, writes/s: 332.73
- [ 13s] threads: 50, tps: 157.27, reads/s: 2096.08, writes/s: 610.70
- [ 14s] threads: 50, tps: 183.04, reads/s: 3074.35, writes/s: 932.72
- [ 15s] threads: 50, tps: 236.03, reads/s: 3175.41, writes/s: 876.11
- [ 16s] threads: 50, tps: 223.04, reads/s: 3082.61, writes/s: 869.17
- [ 17s] threads: 50, tps: 181.02, reads/s: 2475.33, writes/s: 722.10
- [ 18s] threads: 50, tps: 144.03, reads/s: 2002.35, writes/s: 565.10
- [ 19s] threads: 50, tps: 110.91, reads/s: 1810.47, writes/s: 521.56
- [ 20s] threads: 50, tps: 130.02, reads/s: 1765.27, writes/s: 458.07
- [ 21s] threads: 50, tps: 50.01, reads/s: 95.01, writes/s: 102.02
- OLTP test statistics:
- queries performed:
- read: 32886
- write: 9392
- other: 4691
- total: 46969
- transactions: 2342 (110.19 per sec.)
- deadlocks: 101 (4.75 per sec.)
- read/write requests: 42278 (1989.19 per sec.)
- other operations: 4691 (220.71 per sec.)
- Test execution summary:
- total time: 21.2539s
- total number of events: 2248
- total time taken by event execution: 1007.5943s
- per-request statistics:
- min: 69.23ms
- avg: 448.22ms
- max: 2327.38ms
- approx. 95 percentile: 1346.52ms
- Threads fairness:
- events (avg/stddev): 44.9600/8.23
- execution time (avg/stddev): 20.1519/0.34
分析壓測結果 TPS是平均每秒鐘事務提交次數,QPS表示每秒查詢次數(包括read和write) oltp 讀寫比大概2000:600
可以對資料庫進行調優後,再使用sysbench對OLTP進行測試,看看TPS是不是會有所提高。
其實,執行上面的oltp.lua指令碼,對資料庫執行的是下面的sql語句,即有dml(insert、update、delete)語句,也 有select語句。

純insert情況
- [root@dg soft]# /usr/local/sysbench/bin/sysbench --mysql-host=10.72.16.118 --mysql-port=3306 --mysql-user=sysbench --mysql-password=sysbench --mysql-db=test --oltp-tables-count=2 --oltp-table-size=60000 --num-threads=50 --max-requests=100000000 --report-interval=1 --max-time=20 --test=/rman_backup/soft/sysbench-0.5/sysbench/tests/db/insert.lua run
- sysbench 0.5: multi-threaded system evaluation benchmark
- Running the test with following options:
- Number of threads: 50
- Report intermediate results every 1 second(s)
- Random number generator seed is 0 and will be ignored
- Threads started!
- [ 1s] threads: 50, tps: 0.00, reads/s: 0.00, writes/s: 107.83
- [ 2s] threads: 50, tps: 0.00, reads/s: 0.00, writes/s: 10.99
- [ 3s] threads: 50, tps: 0.00, reads/s: 0.00, writes/s: 4.01
- [ 4s] threads: 50, tps: 0.00, reads/s: 0.00, writes/s: 204.03
- [ 5s] threads: 50, tps: 0.00, reads/s: 0.00, writes/s: 170.03
- [ 6s] threads: 50, tps: 0.00, reads/s: 0.00, writes/s: 50.01
- [ 7s] threads: 50, tps: 0.00, reads/s: 0.00, writes/s: 47.96
- [ 8s] threads: 50, tps: 0.00, reads/s: 0.00, writes/s: 78.02
- [ 9s] threads: 50, tps: 0.00, reads/s: 0.00, writes/s: 134.02
- [ 10s] threads: 50, tps: 0.00, reads/s: 0.00, writes/s: 108.02
- [ 11s] threads: 50, tps: 0.00, reads/s: 0.00, writes/s: 43.01
- [ 12s] threads: 50, tps: 0.00, reads/s: 0.00, writes/s: 196.46
- [ 13s] threads: 50, tps: 0.00, reads/s: 0.00, writes/s: 49.88
- [ 14s] threads: 50, tps: 0.00, reads/s: 0.00, writes/s: 38.29
- [ 15s] threads: 50, tps: 0.00, reads/s: 0.00, writes/s: 57.01
- [ 16s] threads: 50, tps: 0.00, reads/s: 0.00, writes/s: 41.01
- [ 17s] threads: 50, tps: 0.00, reads/s: 0.00, writes/s: 192.01
- [ 18s] threads: 50, tps: 0.00, reads/s: 0.00, writes/s: 170.04
- [ 19s] threads: 50, tps: 0.00, reads/s: 0.00, writes/s: 136.02
- [ 20s] threads: 50, tps: 0.00, reads/s: 0.00, writes/s: 86.93
- OLTP test statistics:
- queries performed:
- read: 0
- write: 1979
- other: 0
- total: 1979
- transactions: 0 (0.00 per sec.)
- deadlocks: 0 (0.00 per sec.)
- read/write requests: 1979 (96.34 per sec.)
- other operations: 0 (0.00 per sec.)
- Test execution summary:
- total time: 20.5416s
- total number of events: 1979
- total time taken by event execution: 1008.6923s
- per-request statistics:
- min: 6.64ms
- avg: 509.70ms
- max: 2380.45ms
- approx. 95 percentile: 1465.55ms
- Threads fairness:
- events (avg/stddev): 39.5800/2.64
- execution time (avg/stddev): 20.1738/0.21
建立初始化fileio檔案:
- [root@dg soft]# /usr/local/sysbench/bin/sysbench --test=memory --memory-block-size=8192 --memory-total-size=10M run
- sysbench 0.5: multi-threaded system evaluation benchmark
- Running the test with following options:
- Number of threads: 1
- Random number generator seed is 0 and will be ignored
- Threads started!
- Operations performed: 1280 (351551.77 ops/sec)
- 10.00 MB transferred (2746.50 MB/sec)
- Test execution summary:
- total time: 0.0036s
- total number of events: 1280
- total time taken by event execution: 0.0026s
- per-request statistics:
- min: 0.00ms
- avg: 0.00ms
- max: 0.05ms
- approx. 95 percentile: 0.00ms
- Threads fairness:
- events (avg/stddev): 1280.0000/0.00
- execution time (avg/stddev): 0.0026/0.00
C、對磁碟io效能測試(fileio)
建立初始化fileio檔案:
[root@dg soft]# /usr/local/sysbench/bin/sysbench --test=fileio --num-threads=16 --file-total-size=20M --file-test-mode=rndrw prepare[root@dg soft]# /usr/local/sysbench/bin/sysbench --test=fileio --num-threads=16 --file-total-size=20M --file-test-mode=rndrw runsysbench 0.5: multi-threaded system evaluation benchmarkRunning the test with following options:Number of threads: 16Random number generator seed is 0 and will be ignoredThreads started!Operations performed: 5997 reads, 4003 writes, 12800 Other = 22800 TotalRead 93.703Mb Written 62.547Mb Total transferred 156.25Mb (12.836Mb/sec)821.51 Requests/sec executedTest execution summary:total time: 12.1727stotal number of events: 10000total time taken by event execution: 11.9872sper-request statistics:min: 0.00msavg: 1.20msmax: 255.43msapprox. 95 percentile: 0.04msThreads fairness:events (avg/stddev): 625.0000/61.68execution time (avg/stddev): 0.7492/0.25
指定了最大建立16個執行緒,建立的文件總大小為20m,文件讀寫模式為隨機讀(rndrw),磁碟隨機讀寫的速度大概為12M/s,隨機讀的iops的為821.51 Requests/sec。
D、CPU測試
- [root@dg soft]# /usr/local/sysbench/bin/sysbench --test=cpu --num-threads=32 --cpu-max-prime=90000 run
- sysbench 0.5: multi-threaded system evaluation benchmark
- Running the test with following options:
- Number of threads: 32
- Random number generator seed is 0 and will be ignored
- Primer numbers limit: 90000
- Threads started!
- Test execution summary:
- total time: 279.5934s
- total number of events: 10000
- total time taken by event execution: 8378.2930s
- per-request statistics:
- min: 26.75ms
- avg: 837.83ms
- max: 11742.00ms
- approx. 95 percentile: 3233.89ms
- Threads fairness:
- events (avg/stddev): 312.5000/35.70
- execution time (avg/stddev): 261.8217/16.40
32個執行緒,尋找90000以內的最大素數花了279s
E、測試完成執行cleanup
[root@dg soft]# /usr/local/sysbench/bin/sysbench --test=fileio --num-threads=16 --file-total-size=20M --file-test-mode=rndrw cleanup
參考文件:
http://wenku.baidu.com/link?url=GMpcb1yrTjM_oJyG3rQJFpFOhoc6-s4pacuuV1O1ofutJYfwdcP4Q9aUNRYeRRCvClt_4I_oLszQDcTyk9sY4bl7JyeG-9gaOJBiKUoB5K7
http://my.oschina.net/anthonyyau/blog/277450
http://www.cnblogs.com/taotaohappy/p/4694290.html --請參考這個文件,很全,是keepalived+haproxy+pxc
--pxc啟動順序。如果叢集都關閉了,那麼叢集就都起不來了,因為一個節點啟動前提是必須先有一個其他節點啟動著,但關閉了哪來的存活節點,所以需要按照這個文件的方法來啟動。
--sysbench的使用和測試
-- 實戰體驗幾種MySQLCluster方案
來自 “ ITPUB部落格 ” ,連結:http://blog.itpub.net/28916011/viewspace-1965877/,如需轉載,請註明出處,否則將追究法律責任。
相關文章
- PXC(Percona XtraDB Cluster)叢集安裝
- PXC(Percona XtraDB Cluster)叢集的安裝
- MySQL NDB Cluster,Galera Cluster和Percona XtraDB Cluster優缺點總結MySql
- 安裝配置PXC(Percona XtraDB Cluster)叢集
- docker-compose搭建percona-xtradb-cluster8.0Docker
- MySQL Galera叢集搭建流程(Percona XtraDB Cluster 5.7)MySql
- mysql之 Percona XtraDB Cluster叢集執行緒模型MySql執行緒模型
- PXC(Percona XtraDB Cluster)特性和優缺點介紹
- MySQL高可用方案-PXC(Percona XtraDB Cluster)環境部署詳解MySql
- 基於Docker搭建Percona XtraDB Cluster資料庫叢集Docker資料庫
- PXC(Percona XtraDB Cluster)提供的特性,相容性和限制有哪些?
- 基於Centos7部署Percona Xtradb Cluster高可用架構CentOS架構
- PXC(Percona-XtraDB-Cluster)5.7版本叢集安裝和使用初探
- Redis Cluster深入與實踐(續)Redis
- Percona XtraDB Storage Engine安裝筆記筆記
- Percona XtraDb 針對oracle 版mysql 的增強OracleMySql
- 深度學習的應用與實踐深度學習
- rabbitmq 學習與實踐分享(2)MQ
- rabbitmq 學習與實踐分享(3)MQ
- 目標學習與SCORM實踐薦ORM
- 我的Flutter學習與實踐 | 掘金技術徵文Flutter
- Weex 學習與實踐(二):iOS 整合的 tipsiOS
- Mycat中介軟體實現Percona Cluster讀寫分離
- rabbitmq 實踐與學習心得分享(1)MQ
- 排序學習實踐排序
- 學術派 | 愛奇藝深度語義表示學習的探索與實踐
- 深度學習在搜尋業務中的探索與實踐深度學習
- 決策樹在機器學習的理論學習與實踐機器學習
- 【PWA學習與實踐】(9)生產環境中PWA實踐的問題與解決方案
- Service Worker學習與實踐(二)——PWA簡介
- Service Worker學習與實踐(三)——訊息推送
- Weex 學習與實踐(三):iOS 原理篇iOS
- 分散式快取Redis Cluster在華泰證券的探索與實踐分散式快取Redis
- ReactNative學習實踐:Navigator實踐React
- 【PWA學習與實踐】(1) 2018,開始你的PWA學習之旅
- Composer 學習實踐
- 從零到一的 React 學習與實踐資料索引React索引
- 向敏捷實踐學習,學習敏捷出版敏捷