使用 Grafana、collectd 和 InfluxDB 打造現代監控系統
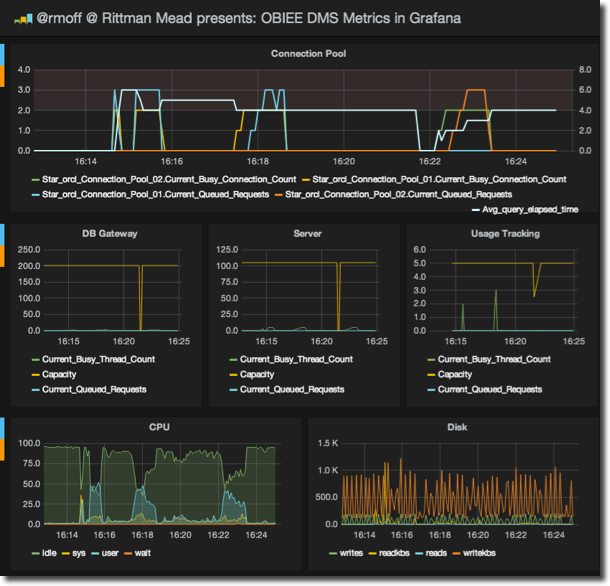
想打造 New Relic 那樣漂亮的實時監控系統我們只需要 InfluxDB/collectd/Grafana 這三個工具,這三個工具的關係是這樣的:
採集資料(collectd)-> 儲存資料(InfluxDB) -> 顯示資料(Grafana)。
- InfluxDB 是 Go 語言開發的一個開源分散式時序資料庫,非常適合儲存指標、事件、分析等資料,看版本號(v0.8.8)就知道這個專案還很年輕;
- collectd 就不用介紹了吧,C 語言寫的一個系統效能採集工具;
- Grafana 是純 Javascript 開發的前端工具,用於訪問 InfluxDB,自定義報表、顯示圖表等。
下面的安裝和配置步驟在 Ubuntu 14.04 Server 64bit 版上完成。升級整個系統後重啟:
$ sudo apt-get update
$ sudo apt-get upgrade
$ sudo reboot
安裝 InfluxDB
InfluxDB 是 Go 寫的,不依賴任何其他包或庫,很乾淨。安裝很容易:
$ wget https://s3.amazonaws.com/influxdb/influxdb_latest_amd64.deb
$ sudo dpkg -i influxdb_latest_amd64.deb
啟動 InfluxDB:
$ sudo /etc/init.d/influxdb start
Setting ulimit -n 65536
Starting the process influxdb [ OK ]
influxdb process was started [ OK ]
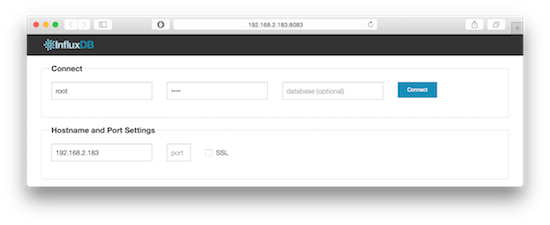
啟動後開啟 web 管理介面 http://192.168.2.183:8083/ 預設使用者名稱和密碼是 root 和 root. InfluxDB 的 Web 管理介面埠是 8083,HTTP API 監聽埠是 8086,如果需要更改這些預設設定,修改 InfluxDB 的配置檔案 /opt/influxdb/current/config.toml 後重啟 InfluxDB 就可以了。
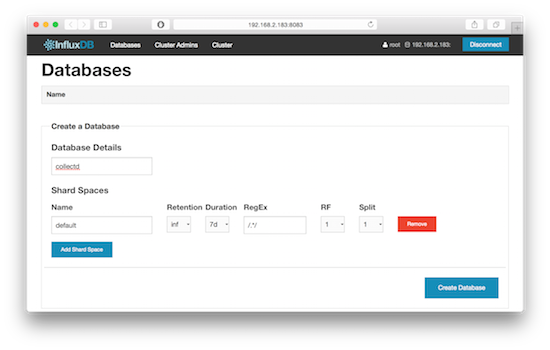
在剛安裝好的 InfluxDB 上建立一個名為 collectd 的資料庫,可以用命令列建立,也可以用 Web 管理介面操作:
$ curl "http://192.168.2.183:8086/db?u=root&p=root" -d "{\"name\": \"collectd\"}"
安裝 collectd
安裝 collectd:
$ sudo apt-get install collectd
配置 collectd 為客戶端,收集到資料後直接發給 InfluxDB:
$ sudo vi /etc/collectd/collectd.conf
...
LoadPlugin network
...
<Plugin network>
        Server "192.168.2.183" "25826"
</Plugin>
...
重啟 collectd:
$ sudo /etc/init.d/collectd restart
InfluxDB 現在自帶一個 collectd 外掛來獲取 collectd 客戶端發來的資料,以前可沒這麼方便哦,0.8.4 版本以前只能透過 influxdb-collectd-proxy 這樣的第三方程式來連線 collectd 和 InfluxDB. 如果你檢查一下伺服器上開啟的埠就會發現 influxdb 外掛啟動了一個 25826 埠,如果發現 InfluxDB 資料庫裡沒有(收集到)資料,務必檢查這個 25826 埠是否正常啟動了:
$ sudo netstat -tupln
Active Internet connections (only servers)
Proto Recv-Q Send-Q Local Address           Foreign Address         State       PID/Program name
tcp        0      0 0.0.0.0:22              0.0.0.0:*               LISTEN      622/sshd
tcp6       0      0 :::8086                 :::*                    LISTEN      668/influxdb
tcp6       0      0 :::22                   :::*                    LISTEN      622/sshd
tcp6       0      0 :::8090                 :::*                    LISTEN      668/influxdb
tcp6       0      0 :::8099                 :::*                    LISTEN      668/influxdb
tcp6       0      0 :::8083                 :::*                    LISTEN      668/influxdb
udp6       0      0 :::25826                :::*                                668/influxdb
InfluxDB 自帶的 collectd 外掛預設是關閉的,需要手動配置開啟 enabled = true,並填上 database = “collectd” 這一行,這裡的 “collectd” 就是我們上面建立的那個資料庫,更改配置後記得重啟 InfluxDB:
$ sudo vi /opt/influxdb/current/config.toml
$ sudo vi /opt/influxdb/shared/config.toml
...
  # Configure the collectd api
  [input_plugins.collectd]
  enabled = true
  # address = "0.0.0.0" # If not set, is actually set to bind-address.
  # port = 25826
  database = "collectd"
  # types.db can be found in a collectd installation or on github:
  # https://github.com/collectd/collectd/blob/master/src/types.db
  # typesdb = "/usr/share/collectd/types.db" # The path to the collectd types.db file
...

$ sudo /etc/init.d/influxdb restart
Setting ulimit -n 65536
Setting ulimit -n 65536
influxdb process was stopped [ OK ]
Setting ulimit -n 65536
Starting the process influxdb [ OK ]
influxdb process was started [ OK ]
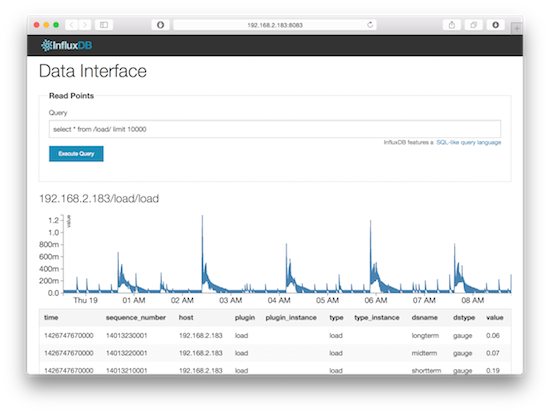
現在 InfluxDB 已經準備好接受和處理 collectd 傳來的資料了。用命令列或者 Web 管理介面驗證一下資料庫裡是否有資料:
$ curl -G 'http://192.168.2.183:8086/db/collectd/series?u=root&p=root&q=list+series&pretty=true'
[
    {
        "name": "list_series_result",
        "columns": [
            "time",
            "name"
        ],
        "points": [
            [
                0,
                "192.168.2.183/cpu-0/cpu-idle"
            ],
...
        ]
    }
]
安裝 Grafana
下載 grafana 後解壓放到 web 伺服器上就可用。這裡省去配置 Nginx/Apache 之類的麻煩,直接用最簡單的 Web 伺服器 python -m SimpleHTTPServer 驅動:
$ wget http://grafanarel.s3.amazonaws.com/grafana-1.9.1.tar.gz
$ tar xzvf grafana-1.9.1.tar.gz
$ cd grafana-1.9.1.tar.gz
$ cp config.sample.js config.js

$ vi config.js
...
      // InfluxDB example setup (the InfluxDB databases specified need to exist)
      datasources: {
        influxdb: {
          type: 'influxdb',
          url: "http://192.168.2.183:8086/db/collectd",
          username: 'root',
          password: 'root',
        },
        ...
      },
...

$ sudo python -m SimpleHTTPServer
用瀏覽器訪問 Grafana,這裡的預設埠是 8000:
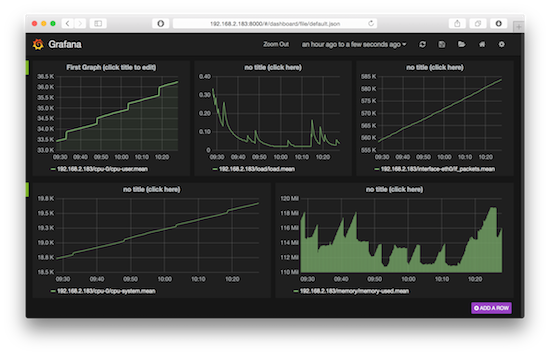
相關文章
- collectd+influxdb+grafana打造圖形化監控系統UXGrafana
- 使用cAdvisor+Influxdb+Grafana監控系統UXGrafana
- Docker 快速實現 【JMeter + InfluxDB + Grafana】 監控方案DockerJMeterUXGrafana
- 神荼之眼——打造現代化監控系統
- 系統效能監控利器-collectd詳解
- 效能測試監控工具--Jmeter + Grafana + InfluxDBJMeterGrafanaUX
- influxdb+grafana+telegraf 伺服器監控UXGrafana伺服器
- jmeter+influxdb+grafana監控平臺搭建JMeterUXGrafana
- 使用Prometheus和Grafana進行系統監控和預測 - flightawarePrometheusGrafana
- Telegraf+Influxdb+Grafana構建監控平臺UXGrafana
- Jmeter監控平臺搭建:JMeter+InfluxDB+GrafanaJMeterUXGrafana
- Telegraf+Influxdb+Grafana自動化運維監控UXGrafana運維
- 利用Grafana監控influxdb表中資料有效性GrafanaUX
- 打造前端監控系統前端
- InfluxDB、Grafana等開源軟體的監控後門UXGrafana
- 藉助Docker搭建JMeter+Grafana+Influxdb監控平臺DockerJMeterGrafanaUX
- 使用Prometheus+Grafana快速打造高逼格監控平臺PrometheusGrafana
- 通過 Telegraf + InfluxDB + Grafana 快速搭建監控體系的詳細步驟UXGrafana
- Docker系列——InfluxDB+Grafana+Jmeter效能監控平臺搭建(二)DockerUXGrafanaJMeter
- Docker系列——InfluxDB+Grafana+Jmeter效能監控平臺搭建(三)DockerUXGrafanaJMeter
- Grafana監控系統的構建與實踐Grafana
- 使用Sar實現系統監控
- Prometheus + InfluxDB + MySQL + Grafna快速構建監控系統PrometheusUXMySql
- 使用Prometheus和Grafana監控Spring Boot應用PrometheusGrafanaSpring Boot
- 分散式監控系統Zabbix--使用Grafana進行圖形展示分散式Grafana
- grafana+prometheus快速搭建MySql監控系統實踐GrafanaPrometheusMySql
- docker-compose 搭建 Prometheus+Grafana監控系統DockerPrometheusGrafana
- 使用Prometheus、Grafana監控Artifactory實踐PrometheusGrafana
- [效能測試+資料採集展示分析+告警策略]Jmeter+Collectd+Influxdb+GrafanaJMeterUXGrafana
- docker-compose快速搭建 Prometheus+Grafana監控系統DockerPrometheusGrafana
- 如何在 Ubuntu 上使用 Grafana 監控 DockerUbuntuGrafanaDocker
- 容器編排系統K8s之Prometheus監控系統+Grafana部署K8SPrometheusGrafana
- Prometheus MySQL監控+grafana展示PrometheusMySqlGrafana
- 開源監控利器grafanaGrafana
- prometheus+grafana 監控nginxPrometheusGrafanaNginx
- 配置 Prometheus 伺服器監控和 Grafana 看板Prometheus伺服器Grafana
- JMeter+InfluxDB+GrafanaJMeterUXGrafana
- 基於Grafana和Prometheus的監視系統(3):java客戶端使用GrafanaPrometheusJava客戶端