在專案初期的時候,大家都是趕著上線,一般來說對日誌沒有過多的考慮,當然日誌量也不大,所以用log4net就夠了,隨著應用的越來越多,日誌散
落在各個伺服器的logs資料夾下,確實有點不大方便,這個時候就想到了,在log4net中配置 mysql的資料來源,不過這裡面有一個坑,熟悉log4net的同學知
道寫入mysql有一個batch的閾值,比如說batchcache中有100條,才寫入mysql,這樣的話,就有一個延遲的效果,而且如果batchcache中不滿100條的話,
你在mysql中是看不到最新的100條日誌。。。而且採用中心化的mysql,涉及到tcp傳輸,其中的效能大家也應該明白,而且mysql沒有一個好的日誌介面,
只能自己去寫UI,所以還還得繼續尋找其他的解決方案,也就是本篇的ELK。
一:ELK名字解釋
ELK就是ElasticSearch + LogStash + Kibana,這三樣搭配起來確實非常不錯,先畫張圖給大家看一下。

1. LogStash
它可以流放到各自的伺服器上收集Log日誌,通過內建的ElasticSearch外掛解析後輸出到ES中。
2.ElasticSearch
這是一個基於Lucene的分散式全文搜尋框架,可以對logs進行分散式儲存,有點像hdfs哈。。。
3. Kibana
所有的log日誌都到ElasticSearch之後,我們需要給他展示出來,對吧? 這個時候Kibana就出手了,它可以多維度的展示es中的資料。這也解決了
用mysql儲存帶來了難以視覺化的問題。
二:快速搭建
上面只是名詞解釋,為了演示,我只在一臺centos上面搭建了。
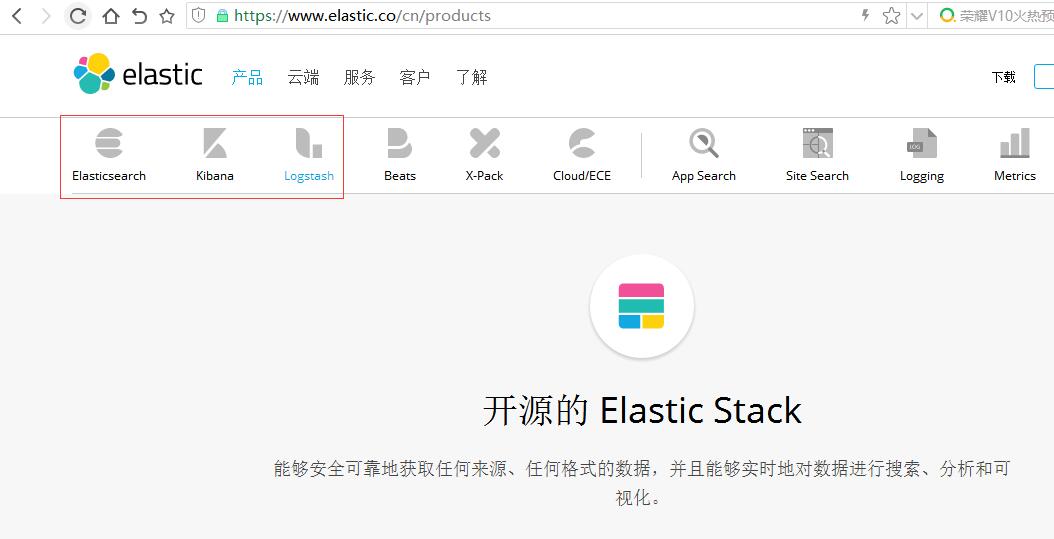
1. 官方下載 :https://www.elastic.co/cn/products,在下面這張圖上,我們找到對應的三個產品,進行下載就好了。
[root@slave1 myapp]# ls
elasticsearch               kafka_2.11-1.0.0.tgz              nginx-1.13.6.tar.gz
elasticsearch-5.6.4.tar.gz  kibana                            node
elasticsearch-head          kibana-5.2.0-linux-x86_64.tar.gz  node-v8.9.1-linux-x64.tar.xz
images                      logstash                          portal
java                        logstash-5.6.3.tar.gz             service
jdk1.8                      logstash-tutorial-dataset         sql
jdk-8u144-linux-x64.tar.gz  nginx
kafka                       nginx-1.13.6
[root@slave1 myapp]#
我這裡下載的是elasticsearch 5.6.4,kibana5.2.0 ,logstash5.6.3三個版本。。。然後用 tar -xzvf解壓一下。
2. logstash配置
解壓完之後,我們到config目錄中新建一個logstash.conf配置。
[root@slave1 config]# ls
jvm.options  log4j2.properties  logstash.conf  logstash.yml  startup.options
[root@slave1 config]# pwd
/usr/myapp/logstash/config
[root@slave1 config]# vim logstash.conf
然後做好input ,filter,output三大塊, 其中input是吸取logs檔案下的所有log字尾的日誌檔案,filter是一個過濾函式,這裡不用配置,output配置了匯入到
hosts為127.0.0.1:9200的elasticsearch中,每天一個索引。
input {
     file {
        type => "log"
        path => "/logs/*.log"
        start_position => "beginning"
    }
}

output {
  stdout {
   codec => rubydebug { }
  }

  elasticsearch {
    hosts => "127.0.0.1"
    index => "log-%{+YYYY.MM.dd}"
  }
}
配置完了之後,我們就可以到bin目錄下啟動logstash了,配置檔案設定為conf/logstash.conf,從下圖中可以看到,當前開啟的是9600埠。
[root@slave1 bin]# ls
cpdump             logstash      logstash.lib.sh  logstash-plugin.bat  setup.bat
ingest-convert.sh  logstash.bat  logstash-plugin  ruby                 system-install
[root@slave1 bin]# ./logstash -f ../config/logstash.conf
Sending Logstash's logs to /usr/myapp/logstash/logs which is now configured via log4j2.properties
[2017-11-28T17:11:53,411][INFO ][logstash.modules.scaffold] Initializing module {:module_name=>"fb_apache", :directory=>"/usr/myapp/logstash/modules/fb_apache/configuration"}
[2017-11-28T17:11:53,414][INFO ][logstash.modules.scaffold] Initializing module {:module_name=>"netflow", :directory=>"/usr/myapp/logstash/modules/netflow/configuration"}
[2017-11-28T17:11:54,063][INFO ][logstash.outputs.elasticsearch] Elasticsearch pool URLs updated {:changes=>{:removed=>[], :added=>[http://127.0.0.1:9200/]}}
[2017-11-28T17:11:54,066][INFO ][logstash.outputs.elasticsearch] Running health check to see if an Elasticsearch connection is working {:healthcheck_url=>http://127.0.0.1:9200/, :path=>"/"}
[2017-11-28T17:11:54,199][WARN ][logstash.outputs.elasticsearch] Restored connection to ES instance {:url=>"http://127.0.0.1:9200/"}
[2017-11-28T17:11:54,244][INFO ][logstash.outputs.elasticsearch] Using mapping template from {:path=>nil}
[2017-11-28T17:11:54,247][INFO ][logstash.outputs.elasticsearch] Attempting to install template {:manage_template=>{"template"=>"logstash-*", "version"=>50001, "settings"=>{"index.refresh_interval"=>"5s"}, "mappings"=>{"_default_"=>{"_all"=>{"enabled"=>true, "norms"=>false}, "dynamic_templates"=>[{"message_field"=>{"path_match"=>"message", "match_mapping_type"=>"string", "mapping"=>{"type"=>"text", "norms"=>false}}}, {"string_fields"=>{"match"=>"*", "match_mapping_type"=>"string", "mapping"=>{"type"=>"text", "norms"=>false, "fields"=>{"keyword"=>{"type"=>"keyword", "ignore_above"=>256}}}}}], "properties"=>{"@timestamp"=>{"type"=>"date", "include_in_all"=>false}, "@version"=>{"type"=>"keyword", "include_in_all"=>false}, "geoip"=>{"dynamic"=>true, "properties"=>{"ip"=>{"type"=>"ip"}, "location"=>{"type"=>"geo_point"}, "latitude"=>{"type"=>"half_float"}, "longitude"=>{"type"=>"half_float"}}}}}}}}
[2017-11-28T17:11:54,265][INFO ][logstash.outputs.elasticsearch] New Elasticsearch output {:class=>"LogStash::Outputs::ElasticSearch", :hosts=>["//127.0.0.1"]}
[2017-11-28T17:11:54,266][INFO ][logstash.pipeline        ] Starting pipeline {"id"=>"main", "pipeline.workers"=>2, "pipeline.batch.size"=>125, "pipeline.batch.delay"=>5, "pipeline.max_inflight"=>250}
[2017-11-28T17:11:54,427][INFO ][logstash.pipeline        ] Pipeline main started
[2017-11-28T17:11:54,493][INFO ][logstash.agent           ] Successfully started Logstash API endpoint {:port=>9600}
3. elasticSearch
這個其實也是ELK中的核心,啟動的時候一定要注意,因為es不可以進行root賬戶啟動,所以你還需要開啟一個elsearch賬戶。
groupadd elsearch                   #新建elsearch組
useradd elsearch -g elsearch -p elasticsearch  #新建一個elsearch使用者
chown -R elsearch:elsearch  ./elasticsearch    #指定elasticsearch所屬elsearch組
接下來我們預設啟動就好了,什麼也不用配置,然後在日誌中大概可以看到開啟了9200,9300埠。
[elsearch@slave1 bin]$ ./elasticsearch
[2017-11-28T17:19:36,893][INFO ][o.e.n.Node               ] [] initializing ...
[2017-11-28T17:19:36,973][INFO ][o.e.e.NodeEnvironment    ] [0bC8MSi] using [1] data paths, mounts [[/ (rootfs)]], net usable_space [17.9gb], net total_space [27.6gb], spins? [unknown], types [rootfs]
[2017-11-28T17:19:36,974][INFO ][o.e.e.NodeEnvironment    ] [0bC8MSi] heap size [1.9gb], compressed ordinary object pointers [true]
[2017-11-28T17:19:36,982][INFO ][o.e.n.Node               ] node name [0bC8MSi] derived from node ID [0bC8MSi_SUywaqz_Zl-MFA]; set [node.name] to override
[2017-11-28T17:19:36,982][INFO ][o.e.n.Node               ] version[5.6.4], pid[12592], build[8bbedf5/2017-10-31T18:55:38.105Z], OS[Linux/3.10.0-327.el7.x86_64/amd64], JVM[Oracle Corporation/Java HotSpot(TM) 64-Bit Server VM/1.8.0_144/25.144-b01]
[2017-11-28T17:19:36,982][INFO ][o.e.n.Node               ] JVM arguments [-Xms2g, -Xmx2g, -XX:+UseConcMarkSweepGC, -XX:CMSInitiatingOccupancyFraction=75, -XX:+UseCMSInitiatingOccupancyOnly, -XX:+AlwaysPreTouch, -Xss1m, -Djava.awt.headless=true, -Dfile.encoding=UTF-8, -Djna.nosys=true, -Djdk.io.permissionsUseCanonicalPath=true, -Dio.netty.noUnsafe=true, -Dio.netty.noKeySetOptimization=true, -Dio.netty.recycler.maxCapacityPerThread=0, -Dlog4j.shutdownHookEnabled=false, -Dlog4j2.disable.jmx=true, -Dlog4j.skipJansi=true, -XX:+HeapDumpOnOutOfMemoryError, -Des.path.home=/usr/myapp/elasticsearch]
[2017-11-28T17:19:37,780][INFO ][o.e.p.PluginsService     ] [0bC8MSi] loaded module [aggs-matrix-stats]
[2017-11-28T17:19:37,780][INFO ][o.e.p.PluginsService     ] [0bC8MSi] loaded module [ingest-common]
[2017-11-28T17:19:37,780][INFO ][o.e.p.PluginsService     ] [0bC8MSi] loaded module [lang-expression]
[2017-11-28T17:19:37,780][INFO ][o.e.p.PluginsService     ] [0bC8MSi] loaded module [lang-groovy]
[2017-11-28T17:19:37,780][INFO ][o.e.p.PluginsService     ] [0bC8MSi] loaded module [lang-mustache]
[2017-11-28T17:19:37,780][INFO ][o.e.p.PluginsService     ] [0bC8MSi] loaded module [lang-painless]
[2017-11-28T17:19:37,780][INFO ][o.e.p.PluginsService     ] [0bC8MSi] loaded module [parent-join]
[2017-11-28T17:19:37,780][INFO ][o.e.p.PluginsService     ] [0bC8MSi] loaded module [percolator]
[2017-11-28T17:19:37,781][INFO ][o.e.p.PluginsService     ] [0bC8MSi] loaded module [reindex]
[2017-11-28T17:19:37,781][INFO ][o.e.p.PluginsService     ] [0bC8MSi] loaded module [transport-netty3]
[2017-11-28T17:19:37,781][INFO ][o.e.p.PluginsService     ] [0bC8MSi] loaded module [transport-netty4]
[2017-11-28T17:19:37,781][INFO ][o.e.p.PluginsService     ] [0bC8MSi] no plugins loaded
[2017-11-28T17:19:39,782][INFO ][o.e.d.DiscoveryModule    ] [0bC8MSi] using discovery type [zen]
[2017-11-28T17:19:40,409][INFO ][o.e.n.Node               ] initialized
[2017-11-28T17:19:40,409][INFO ][o.e.n.Node               ] [0bC8MSi] starting ...
[2017-11-28T17:19:40,539][INFO ][o.e.t.TransportService   ] [0bC8MSi] publish_address {192.168.23.151:9300}, bound_addresses {[::]:9300}
[2017-11-28T17:19:40,549][INFO ][o.e.b.BootstrapChecks    ] [0bC8MSi] bound or publishing to a non-loopback or non-link-local address, enforcing bootstrap checks
[2017-11-28T17:19:43,638][INFO ][o.e.c.s.ClusterService   ] [0bC8MSi] new_master {0bC8MSi}{0bC8MSi_SUywaqz_Zl-MFA}{xcbC53RVSHajdLop7sdhpA}{192.168.23.151}{192.168.23.151:9300}, reason: zen-disco-elected-as-master ([0] nodes joined)
[2017-11-28T17:19:43,732][INFO ][o.e.h.n.Netty4HttpServerTransport] [0bC8MSi] publish_address {192.168.23.151:9200}, bound_addresses {[::]:9200}
[2017-11-28T17:19:43,733][INFO ][o.e.n.Node               ] [0bC8MSi] started
[2017-11-28T17:19:43,860][INFO ][o.e.g.GatewayService     ] [0bC8MSi] recovered [1] indices into cluster_state
[2017-11-28T17:19:44,035][INFO ][o.e.c.r.a.AllocationService] [0bC8MSi] Cluster health status changed from [RED] to [YELLOW] (reason: [shards started [[.kibana][0]] ...]).
4. kibana
它的配置也非常簡單,你需要在kibana.yml檔案中指定一下你需要讀取的elasticSearch地址和可供外網訪問的bind地址就可以了。
[root@slave1 config]# pwd
/usr/myapp/kibana/config

[root@slave1 config]# vim kibana.yml

elasticsearch.url: "http://localhost:9200"
server.host: 0.0.0.0
然後就是啟動,從日誌中可以看出,當前開了5601埠。
[root@slave1 kibana]# cd bin
[root@slave1 bin]# ls
kibana  kibana-plugin  nohup.out
[root@slave1 bin]# ./kibana
  log   [01:23:27.650] [info][status][plugin:kibana@5.2.0] Status changed from uninitialized to green - Ready
  log   [01:23:27.748] [info][status][plugin:elasticsearch@5.2.0] Status changed from uninitialized to yellow - Waiting for Elasticsearch
  log   [01:23:27.786] [info][status][plugin:console@5.2.0] Status changed from uninitialized to green - Ready
  log   [01:23:27.794] [warning] You're running Kibana 5.2.0 with some different versions of Elasticsearch. Update Kibana or Elasticsearch to the same version to prevent compatibility issues: v5.6.4 @ 192.168.23.151:9200 (192.168.23.151)
  log   [01:23:27.811] [info][status][plugin:elasticsearch@5.2.0] Status changed from yellow to green - Kibana index ready
  log   [01:23:28.250] [info][status][plugin:timelion@5.2.0] Status changed from uninitialized to green - Ready
  log   [01:23:28.255] [info][listening] Server running at http://0.0.0.0:5601
  log   [01:23:28.259] [info][status][ui settings] Status changed from uninitialized to green - Ready
5. 瀏覽器中輸入:http://192.168.23.151:5601/ 你就可以開啟kibana頁面了,,預設讓我指定一個檢視的Index。

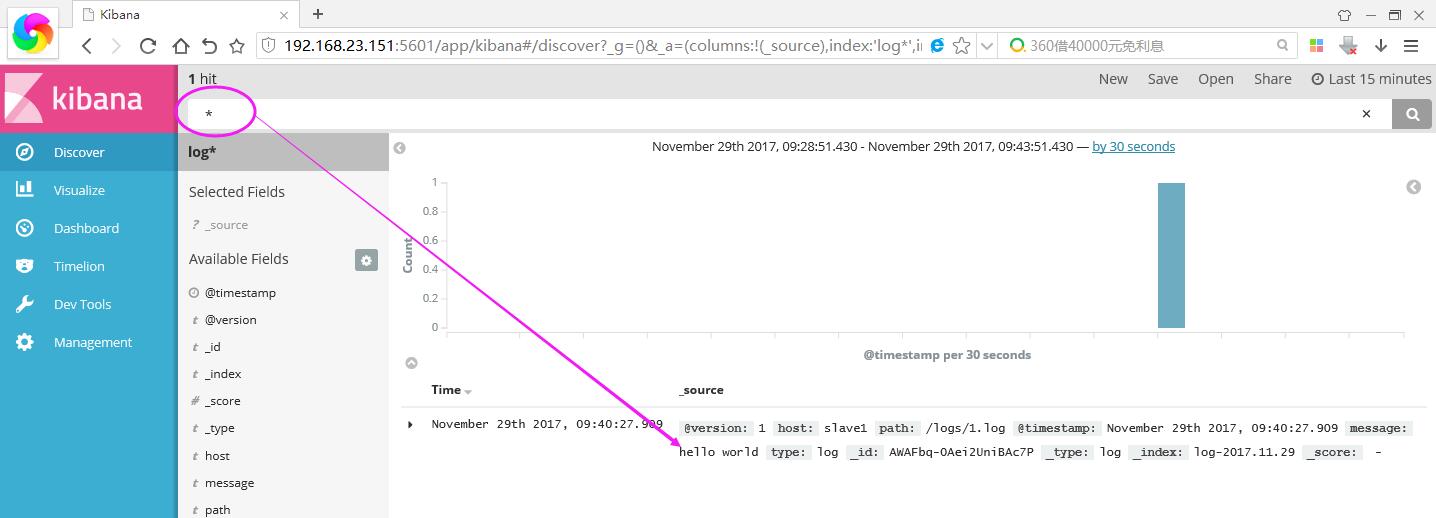
接下來我們在本機的/logs資料夾下建立一個簡單的1.log檔案,內容為“hello world”,然後在kibana上將logstash-* 改成 log* ,Create按鈕就會自動出來。
[root@slave1 logs]# echo 'hello world' > 1.log

進入之後,點選Discover,你就可以找到你輸入的內容啦~~~~ 是不是很帥氣。。。
如果你裝了head安裝包,你還可以看到它確實帶了日期模式的Index索引,還自帶5個預設分片數。

好了,本篇就說這麼多吧,希望對你有幫助。