一個簡單的例子!
環境:CentOS6.5
Hadoop叢集、Hive、R、RHive,具體安裝及除錯方法見部落格內文件。
1、分析題目
--有一個使用者資料樣本(表名huserinfo)10萬資料左右;
--其中有一個欄位:身份證號(id_card)
--身份證號前兩位代表:省,例如:11北京,12天津,13河北;
--身份證前x位對照表(表名hidcard_province)
--要求1:計算出每個省份出現的次數,並按從大到小排序取前30個;
--要求2:使用R畫出柱狀圖。
2、編寫Hive提取資料指令碼:hive_getdata.sql
--建立臨時表
DROP TABLE if exists tmp.t_province;
CREATE TABLE tmp.t_province(
    id int,
    p_name string,
    cnt int
) COMMENT '使用者資料中省份出現次數臨時表'

--將提取到的資料儲存到臨時表中
insert overwrite table tmp.t_province
select t1.cid, t2.province, t1.cnt from(
    --取出前30條
    select y.rownum, y.cid, y.cnt from(
        --排序
        select x.cid, x.cnt, row_number() over (distribute by x.cnt sort by x.cnt desc) as rownum from(
            --分組
            select a1.cid, count(1) as cnt from
                --取資料
                (select substring(id_card, 0, 2) as cid from bdm.huserinfo)a1
            group by a1.cid
        )x
    )y where y.rownum <= 30
)t1
join bdm.hidcard_province t2 on t2.id = t1.cid
執行:
[root@Hadoop-NN-01 ~]$ hive -f hive_getdata.sql
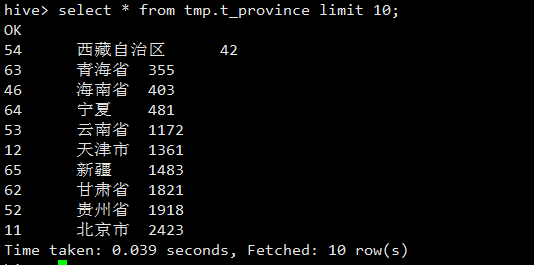
檢視資料如下圖:
hive> select * from tmp.t_province limit 10;
3、編寫R語言繪圖指令碼:r_draw.r
#!/usr/bin/Rscript
library(RHive);  #載入rhive包
rhive.connect(host ='192.168.100.20');  #rhive連線hive
x <- rhive.query('select id from tmp.t_province')
x <- x$id
y <- rhive.query('select cnt from tmp.t_province')
y <- y$cnt

library(Cairo)   #載入圖形渲染庫

png("r-province-pic.png", width=960, height=600)  #生成圖片
#說明:此裡可以處理很多問題,可以使用很多演算法解決很多的問題,具體演算法我就不寫了,只簡單畫個柱柱圖,把程式碼跑通即可!
barplot(beside=TRUE,
    y,               #縱軸
    names.arg=x,     #橫軸
    ylim=c(0,10000)  #縱軸取值範圍  還有其它引數,可以根據自己需求設定。
)

title(xlab="province name") #橫軸名稱
title(ylab="people number") #縱軸名稱

#圖例引數
lbls <- round(y/sum(y)*100)
lbls <- paste(lbls,"%",sep="")
lbls <- paste(x, lbls)

#設定圖例 其它引數根據自己需求設定
legend("topright", lbls)

dev.off()       #關閉繪圖裝置
rhive.close()   #關閉hive連線
執行:
[root@Hadoop-NN-01 ~]$ Rscript r_draw.r
展示成果:
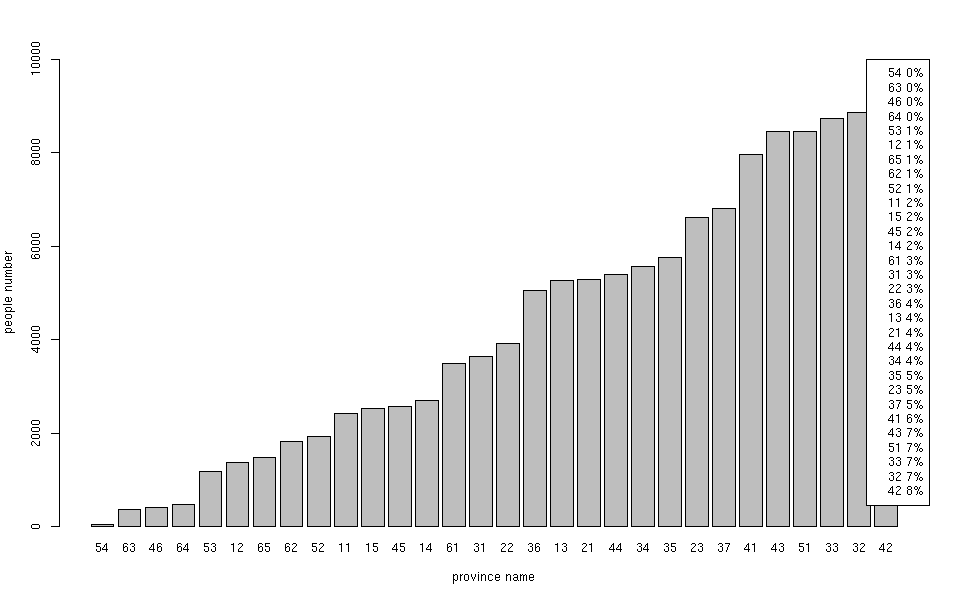
至此,一個簡單的Hadoop-Hive-R例項完成!
PS:R下面中文亂碼的問題仍在解決中!