一個簡單的例子!
環境:CentOS6.5
Hadoop叢集、Hive、R、RHive,具體安裝及除錯方法見部落格內文件。
1、分析題目
--有一個使用者點選資料樣本(husercollect)
--按使用者訪問的時間(時)統計
--要求:分析時間和點選次數的聚類情況
2、資料準備
--建立臨時表
DROP TABLE if exists tmp.t2_collect;
CREATE TABLE tmp.t2_collect(
    h int,
    cnt int
) COMMENT '使用者點選資料臨時表';

--插入臨時表
insert overwrite table tmp.t2_collect
--分組
select a1.h, count(1) as cnt from(
    --取出時
    select hour(createtime) as h from bdm.husercollect
)a1
group by a1.h;
3、評估K值
#!/usr/bin/Rscript
library(RHive)
rhive.connect(host ='192.168.107.82')
data <- rhive.query('select h,cnt from tmp.t2_collect limit 6000')
x <- data$h
y <- data$cnt

--組合成資料框
df <- data.frame(x, y)
--新增列名
colnames(df) <- c("hour", "cnt")

--cluster.stats函式需要使用fpc庫
library(fpc)

--k取2到8評估K
K <- 2:8
--每次迭代30次,避免區域性最優
round <- 30
rst <- sapply(K, function(i){
    print(paste("K=",i))
    mean(sapply(1:round,function(r){
        print(paste("Round",r))
        result <- kmeans(df, i)
        stats <- cluster.stats(dist(df), result$cluster)
        stats$avg.silwidth
    }))
})

--載入圖形庫
library(Cairo)
png("k-points-pic.png", width=800, height=600)
plot(K, rst, type='l', main='outline & R relation', ylab='outline coefficient')

dev.off()
rhive.close()
評估結果:
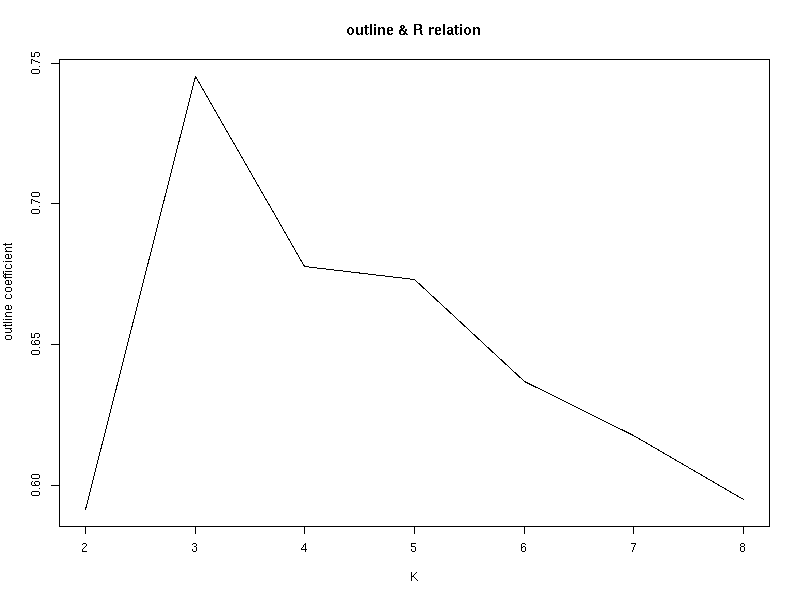
由上圖可見當K=3時,輪廓係數最大。
4、聚類分析
#!/usr/bin/Rscript
library(RHive)
rhive.connect(host ='192.168.107.82')
data <- rhive.query('select h,cnt from tmp.t2_collect limit 6000')
x <- data$h
y <- data$cnt

--組合成資料框
df <- data.frame(x, y)
--新增列名
colnames(df) <- c("hour", "cnt")

--Kmeans
kc <- kmeans(df, 3);

--具體分類情況
--fitted(kc);

library(Cairo)
png("k-means-pic.png", width=800, height=600)
plot(df[c("hour", "cnt")], col = kc$cluster, pch = 8);
points(kc$centers[,c("hour", "cnt")], col = 1:3, pch = 8, cex=2);

dev.off()
rhive.close()
聚類結果:

至此,一個簡單的K-means聚類演算法例項完成!