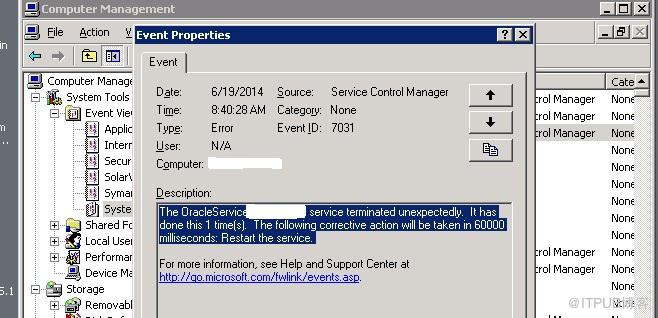
The OracleService$$$ service terminated unexpectedly.
Oracle.exe服務異常直接導致服務關閉:
檢查DB alert_sid.log無任何有用資訊
14/06/19/06:40 ---
--- CHECK TIME : 14/06/19/06:50 ---
--- CHECK TIME : 14/06/19/07:00 ---
--- CHECK TIME : 14/06/19/07:10 ---
--- CHECK TIME : 14/06/19/07:20 ---
--- CHECK TIME : 14/06/19/07:30 ---
--- CHECK TIME : 14/06/19/07:40 ---
--- CHECK TIME : 14/06/19/07:50 ---
--- CHECK TIME : 14/06/19/08:00 ---
Thu Jun 19 08:05:16 2014
Thread 1 advanced to log sequence 3350 (LGWR switch)
Current log# 2 seq# 3350 mem# 0: E:\ORADATA\PRODDB01\REDO2A.LOG
Current log# 2 seq# 3350 mem# 1: E:\ORADATA\PRODDB01\REDO2B.ORA
--- CHECK TIME : 14/06/19/08:10 ---
--- CHECK TIME : 14/06/19/08:20 ---
--- CHECK TIME : 14/06/19/08:30 ---
--- CHECK TIME : 14/06/19/08:40 ---
Dump file d:\oracle\admin\proddb01\bdump\alert_proddb01.log
Thu Jun 19 08:41:31 2014
ORACLE V10.2.0.4.0 - Production vsnsta=0
vsnsql=14 vsnxtr=3
Windows Server 2003 Version V5.2 Service Pack 2
CPU : 4 - type 586, 4 Physical Cores
Process Affinity : 0x00000000
Memory (Avail/Total): Ph:1481M/3325M, Ph+PgF:7030M/9246M, VA:2936M/3071M
Thu Jun 19 08:41:31 2014
Starting ORACLE instance (normal)
LICENSE_MAX_SESSION = 0
LICENSE_SESSIONS_WARNING = 0
Picked latch-free SCN scheme 2
Autotune of undo retention is turned on.
IMODE=BR
ILAT =61
LICENSE_MAX_USERS = 0
SYS auditing is disabled
ksdpec: called for event 13740 prior to event group initialization
Starting up ORACLE RDBMS Version: 10.2.0.4.0.
System parameters with non-default values:
processes = 500
sessions = 555
__shared_pool_size = 373293056
__large_pool_size = 4194304
__java_pool_size = 4194304
__streams_pool_size = 4194304
sga_target = 629145600
control_files = E:\ORADATA\PRODDB01\CONTROL01.CTL, E:\ORADATA\PRODDB01\CONTROL02.CTL, E:\ORADATA\PRODDB01\CONTROL03.CTL
db_block_size = 8192
__db_cache_size = 239075328
compatible = 10.2.0.3.0
log_archive_dest_1 = LOCATION=d:\arc\proddb01
log_archive_dest_2 = LOCATION=e:\arc\proddb01
log_archive_format = ARC%S_%R.%T
db_file_multiblock_read_count= 16
undo_management = AUTO
undo_tablespace = UNDOTBS1
remote_login_passwordfile= EXCLUSIVE
db_domain = sae.com.hk
dispatchers = (PROTOCOL=TCP) (SERVICE=proddb01XDB)
job_queue_processes = 10
audit_file_dest = D:\ORACLE\ADMIN\PRODDB01\ADUMP
background_dump_dest = D:\ORACLE\ADMIN\PRODDB01\BDUMP
user_dump_dest = D:\ORACLE\ADMIN\PRODDB01\UDUMP
core_dump_dest = D:\ORACLE\ADMIN\PRODDB01\CDUMP
db_name = proddb01
open_cursors = 300
pga_aggregate_target = 314572800
Windows 工程師分析dump檔案給出的分析為:
詳細分析過程:
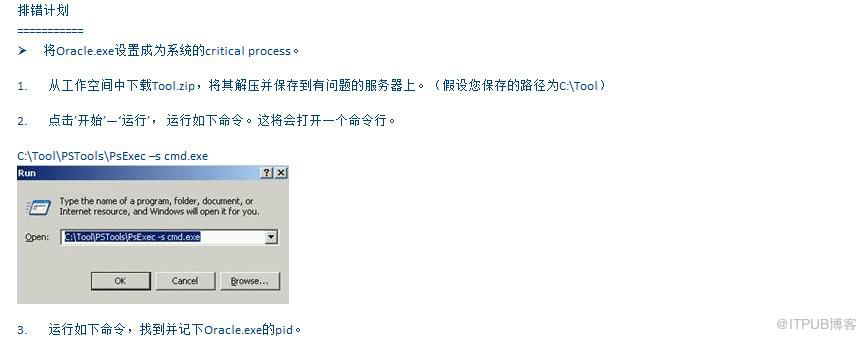
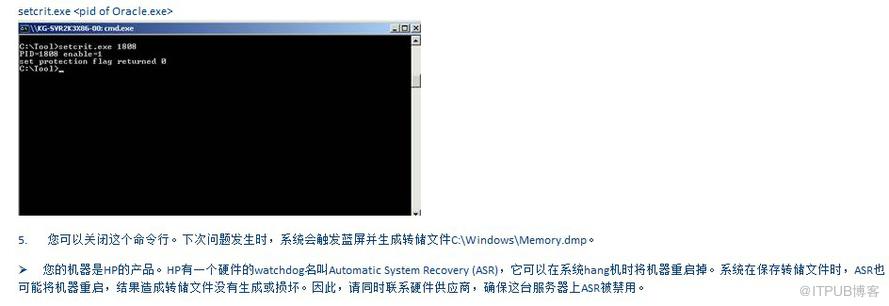
1,將Oracle.exe服務設定為windows關鍵程式

以下是具體的dump分析,您可以將其提供給Oracle做參考;也可供您更詳細地理解問題。
具體分析
==========
1. 藍屏是由Oracle.exe退出引起的。但是它為什麼要退出呢?從dump看到有程式正在和其通訊。
3: kd> !thread
THREAD fac4f020 Cid 01bc.123c Teb: 7fff0000 Win32Thread: e1b77e08 RUNNING on processor 3
Not impersonating
DeviceMap e18008d8
Owning Process fc0fb728 Image: csrss.exe
Attached Process N/A Image: N/A
Wait Start TickCount 88259683 Ticks: 49 (0:00:00:00.765)
Context Switch Count 2514675 IdealProcessor: 0 LargeStack
UserTime 00:00:52.734
KernelTime 00:01:09.218
Win32 Start Address 0x031b19d7
LPC Server thread working on message Id 31b19d7
Start Address CSRSRV!CsrApiRequestThread (0x75a548de)
Stack Init f3191000 Current f3190bf4 Base f3191000 Limit f318e000 Call 0
Priority 15 BasePriority 13 PriorityDecrement 0
ChildEBP RetAddr Args to Child
f3190c7c e09a6b0c 000000f4 00000003 facc5020 nt!KeBugCheckEx+0x1b
f3190ca0 e0969a42 e0969a8c facc5020 facc5184 nt!PspCatchCriticalBreak+0x75
f3190cd0 f536b259 000014fc 00000080 fc19b290 nt!NtTerminateProcess+0x7a
f3190d40 fc19b2ae e4873668 000014fc 00000080 SYMEVENT+0x17259
f3190d54 e08338db 000014fc 00000080 0183febc 0xfc19b2ae
f3190d54 7c82845c 000014fc 00000080 0183febc nt!KiSystemServicePostCall
0183fea0 7c827a89 75a5441a 000014fc 00000080 ntdll!KiFastSystemCallRet
…
2. 檢查這個本地過程呼叫。執行緒fc816020正在等待這次通訊的反饋。
3: kd> !lpc message 31b19d7
Searching message 31b19d7 in threads ...
Server thread fac4f020 is working on message 31b19d7
Client thread fc816020 waiting a reply from 31b19d7
Searching thread fc816020 in port rundown queues ...
Server connection port e49baf68 Name: ApiPort
Handles: 1 References: 233
Server process : fc0fb728 (csrss.exe)
Queue semaphore : fc80db78
Semaphore state 0 (0x0)
The message queue is empty
The LpcDataInfoChainHead queue is empty
Done.
3. 檢查執行緒fc816020,原來是Oracle的執行緒發生了異常。異常處理函式無法處理此異常,因此程式退出。
3: kd> !winde.t fc816020
!t fc816020 Thread !tu fc816020 !k fc816020 !ku fc816020 !kp fc816020 !kpu fc816020
!THREAD fc816020 Cid 1430.05a0 Teb: bff8f000 Win32Thread: 00000000 WAIT: (WrLpcReply) UserMode Non-Alertable
fc81620c Semaphore Limit 0x1
Waiting for reply to LPC MessageId 031b19d7:
Current LPC port e49baf68
Not impersonating
DeviceMap e18008d8
Owning Process facc5020 Image: oracle.exe
Attached Process N/A Image: N/A
Wait Start TickCount 88259732 Ticks: 0
Context Switch Count 137 IdealProcessor: 3
UserTime 00:00:00.078
KernelTime 00:00:00.015
Win32 Start Address ORACLE (0x004018ac)
Start Address kernel32!BaseThreadStartThunk (0x77e617d4)
Stack Init f4509000 Current f4508654 Base f4509000 Limit f4506000 Call 0
Priority 10 BasePriority 8 PriorityDecrement 0
ChildEBP RetAddr Args to Child
f450866c e083d178 fc816020 fc8160c8 00000002 nt!KiSwapContext+0x26 (FPO: [Uses EBP] [0,0,4])
f4508698 e083db5e fc8161e0 fc816020 00000000 nt!KiSwapThread+0x2e5 (FPO: [Non-Fpo]) (CONV: fastcall)
f45086e0 e091d215 fc81620c 00000011 00000001 nt!KeWaitForSingleObject+0x346 (FPO: [Non-Fpo]) (CONV: stdcall)
f4508714 e099c161 e49baf68 e49baf68 f4508748 nt!LpcpRequestWaitReplyPort+0x32c (FPO: [Non-Fpo]) (CONV: stdcall)
f450872c e09c8386 e49baf68 f45088c0 f4508748 nt!LpcRequestWaitReplyPortEx+0x21 (FPO: [Non-Fpo]) (CONV: stdcall)
f45088a8 e097a076 f45088c0 e49baf68 00000000 nt!DbgkpSendApiMessageLpc+0x4b (FPO: [Non-Fpo]) (CONV: stdcall)
f4508938 e085b798 f4508d10 00000000 00000001 nt!DbgkForwardException+0x85 (FPO: [Non-Fpo]) (CONV: stdcall)
f4508cf4 e08343ac f4508d10 00000000 f4508d64 nt!KiDispatchException+0x37f (FPO: [Non-Fpo]) (CONV: stdcall)
f4508d5c e0834360 0e201014 77e61a0b badb0d00 nt!CommonDispatchException+0x4a (FPO: [0,20,0]) (CONV: M32R)
f4508d64 77e61a0b badb0d00 00000000 00000000 nt!KiExceptionExit+0x186
f4508d68 badb0d00 00000000 00000000 00000000 kernel32!__SEH_prolog+0x1a ----- 此處,發生了異常
4. 到此問題變為,Oracle的執行緒什麼會發生異常。
5. 檢查暫存器。暫存器ESP指向棧頂。 而它當前的值是非法的。
3: kd> r
Last set context:
eax=00000010 ebx=0e201114 ecx=0e201720 edx=00000000 esi=003b8b0c edi=0e20172c
eip=77e61a0b esp=0e200ff4 ebp=0e201014 iopl=0 nv up ei pl nz na po nc
cs=001b ss=0023 ds=0023 es=0023 fs=003b gs=0000 efl=00010202
KERNEL32!__SEH_prolog+0x1a:
001b:77e61a0b 53 push ebx
3: kd> dc 0e200ff4
0e200ff4 ???????? ???????? ???????? 00000000 ????????????....
0e201004 0e2010bc 77e61a48 77e5c0b6 77e5c110 .. .H..w...w...w
0e201014 0e2010c8 65241e2f 0e20172c 00000004 .. ./.$e,. .....
0e201024 f1704448 0e2015e0 00000000 0e201184 HDp... ....... .
0e201034 00000000 003b8b0c 00000000 0e2015e0 ......;....... .
0e201044 0e201114 0e201124 00000000 00000000 .. .$. .........
0e201054 00000000 00000000 00000000 00000000 ................
0e201064 00000000 00000000 00000000 00000000 ................
6. 檢查此執行緒,發現它的Stack limit在0e201000處,因此當要訪問0e200ff4時,發生了越界。
3: kd> !teb
TEB at bff8f000
ExceptionList: 0e2010bc
StackBase: 0e300000
StackLimit: 0e201000
SubSystemTib: 00000000
FiberData: 00001e00
ArbitraryUserPointer: 00000000
Self: bff8f000
EnvironmentPointer: 00000000
ClientId: 00001430 . 000005a0
RpcHandle: 00000000
Tls Storage: 0ba98ba0
PEB Address: bffde000
LastErrorValue: 0
LastStatusValue: 0
Count Owned Locks: 0
HardErrorMode: 0
7. 仔細檢查call stack。發現Oracle的一個函式呼叫佔用了大量的棧空間,我認為是它造成了越界。
eax=00000010 ebx=0e201114 ecx=0e201720 edx=00000000 esi=003b8b0c edi=0e20172c
eip=77e61a0b esp=0e200ff4 ebp=0e201014 iopl=0 nv up ei pl nz na po nc
cs=001b ss=0023 ds=0023 es=0023 fs=003b gs=0000 efl=00010202
kernel32!__SEH_prolog+0x1a:
001b:77e61a0b 53 push ebx
*** Stack trace for last set context - .thread/.cxr resets it
ChildEBP RetAddr Args to Child
0e201014 65241e2f 0e20172c 00000004 f1704448 kernel32!__SEH_prolog+0x1a ----- 此處,發生了異常,stack越界
0e2010c8 652422c4 0e2015e0 003b8b0c 0e201720 SYSFER+0x1e2f
0e201154 6527a4e2 00000000 0e201720 f17046f8 SYSFER+0x22c4
0e201278 6527a6cc 0e201720 f1704608 00000000 SYSFER!FirstHookFunc+0x13a52
0e2013f0 6527acd1 0e2015e0 003b8a98 0e201720 SYSFER!FirstHookFunc+0x13c3c
0e201468 6527b32d 0e2015e0 00000002 0e201720 SYSFER!FirstHookFunc+0x14241
0e2015ac 65268aef 0e2015e0 00000002 0e201720 SYSFER!FirstHookFunc+0x1489d
0e201658 65268c7f 00000002 0e20170c f1704250 SYSFER!FirstHookFunc+0x205f
0e2016d0 65268d76 00000002 0e20170c 00000001 SYSFER!FirstHookFunc+0x21ef
0e201714 7c826d59 77e64f7c 0e2017c4 001f03ff SYSFER!FirstHookFunc+0x22e6
0e201718 77e64f7c 0e2017c4 001f03ff 00000000 ntdll!ZwCreateThread+0xc
0e201b70 77e65125 ffffffff 00000000 00000000 kernel32!CreateRemoteThread+0xf2
0e201b94 0042d1a9 00000000 00000000 0042d8cc kernel32!CreateThread+0x1e
0e202adc 00401a8d c00000fd 0e202b0c 0000009f ORACLE+0x2d1a9 ---- 但我認為真正的問題發生在這裡,這個函式呼叫佔用了大量的棧空間。
0e2fffb8 77e6481f 0ddeff9c 00000000 00000000 ORACLE+0x1a8d
0e2fffec 00000000 004018ac 0ddeff9c 00000000 kernel32!BaseThreadStart+0x34
3: kd> ? 0e2fffb8-0e202adc
Evaluate expression: 1037532 = 000fd4dc
來自 “ ITPUB部落格 ” ,連結:http://blog.itpub.net/24867586/viewspace-1188850/,如需轉載,請註明出處,否則將追究法律責任。
相關文章
- Timeout (30000 milliseconds) waiting for the OracleService service to connect.AIOracle
- The SQL Server (MSSQLSERVER) service terminated with service-specific error 1814 (0x716).SQLServerError
- FIELDS TERMINATED BY WHITESPACE & FIELDS TERMINATED BY x'09'
- FIELDS TERMINATED BY WHITESPACE & FIELDS TERMINATED BY x'09' 區別
- Terminated With Error ORA-474: SMON Process Terminated With Error-1361872.1Error
- JVM terminated. Exit code=1JVM
- ora-01092 oracle instance terminatedOracle
- 關於win平臺下,oracleservice<sid>無法正常啟動的問題Oracle
- 什麼是web service?- SOAP Web Service & Restful Web ServiceWebREST
- eclipse出現jvm terminated exit code=1問題[轉]EclipseJVM
- Service異常:Service Intent must be explicitIntent
- Android Service 服務(一)—— ServiceAndroid
- idea 報錯maven [ERROR] Maven execution terminated abnormally (exit code 1)IdeaMavenErrorORM
- MRP0- Background Media Recovery terminated with error 1111Error
- infrastructure as a serviceASTStruct
- sqli-labs————Less-47(procedure alalyse\lines terminated by利用)SQL
- MRP0: Background Media Recovery terminated with error 328,ORA-00328Error
- Rman-10038: Database Session For Channel D1 Terminated UnexpectedlyDatabaseSession
- ASM例項出現ORA-04031導致Instance terminated by ASMBASM
- k8s之Service詳解-Service使用K8S
- Service Worker初探
- Service Locator 模式模式
- 建立windows serviceWindows
- Android ServiceAndroid
- Service詳解
- systemd service unit
- deploy service on swarmSwarm
- angular service/directiveAngular
- xml web serviceXMLWeb
- vnc service on ubuntuVNCUbuntu
- Oracle Database ServiceOracleDatabase
- In Oracle,What Is a Service?Oracle
- WCF Rest ServiceREST
- Web Service 教程Web
- 深入掌握service
- 【Oracle】service_name和service_names的關係Oracle
- 【應用服務 App Service】App Service 新手資料包APP
- 升級遇到 ORA-01092: ORACLE instance terminated. Disconnection forcedOracle