【體系結構】Oracle資料提交與事務隔離實驗 oradebug掛起lgwr程式
Oracle資料提交與事務隔離實驗
oradebug掛起lgwr程式
原文作者:dbsnake 崔華
實驗參考原文連結:
Oracle 裡未 commit 的資料除了當前 session 之外,其他 session 是看不到的。
Oracle裡未成功 commit 的資料我們也可能能看到。
同時啟4個 session:
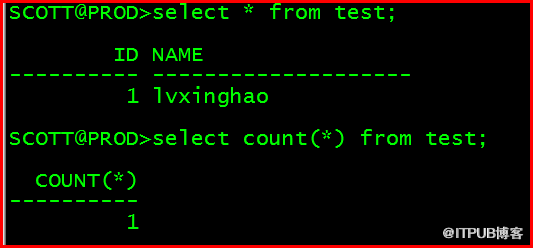
session 1: 建立測試表test,插入一條資料但不提交
SCOTT@PROD>create table test (id number,name varchar2(20));
SCOTT@PROD>insert into test values (1,'lvxinghao');
SCOTT@PROD>select * from test;

session 2:檢視test表,由於session 1未commit,session 2檢視不到這條資料
SCOTT@PROD>select * from test;
SCOTT@PROD>select count(*) from test;

session 3:sys使用者檢視並把lgwr程式suspend住(掛起):
作業系統檢視LGWR程式號
[oracle@rhel64 ~]$ ps -ef | grep lgwr | grep -v grep

sys使用者檢視lgwr後臺程式對應作業系統pid:
SYS@PROD>select spid from v$process where pname='LGWR';

掛起lgwr程式
SYS@PROD>oradebug setospid 5528
SYS@PROD>oradebug suspend

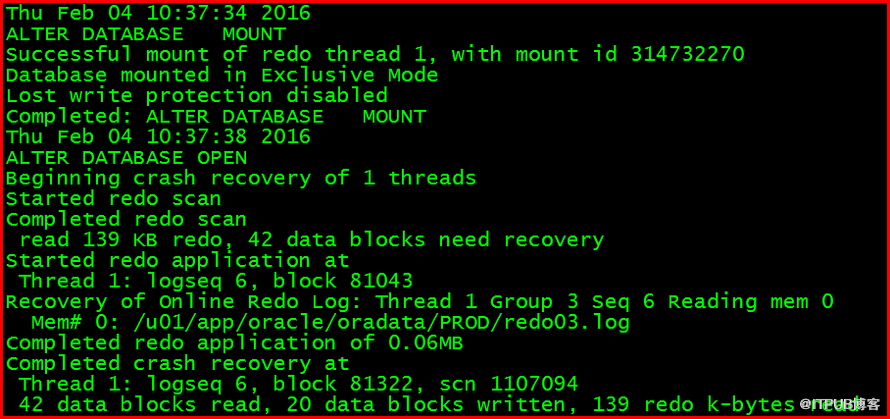
alert日誌中資訊顯示
[oracle@rhel64 ~]$ tail -f $ORACLE_BASE/diag/rdbms/prod/PROD/trace/alert_PROD.log

session 1:執行commit命令,由於lgwr程式被掛起,commit命令hang住
SCOTT@PROD>commit;

session 2:再次檢視test表中資料,能夠顯示出來
SCOTT@PROD>select * from test;
SCOTT@PROD>select count(*) from test;
從結果來看,之前看不到的那條記錄現在已經能看到了,即session 1對於session2而言已經commit了,儘管由於lgwr被掛起,session1的commit操作並沒有成功的做完。
Oracle 裡 commit 操作時,
1、修改事務所對應的 undo segment header 中 slot 的狀態;
2、改完狀態後再 flush log buffer;
session 3中把lgwr 掛起了,步驟2 無法完成,但步驟1還可以完成。
只要步驟1做完了,其他的 session 就能看到這個事務所做的改變了(透過ITL中記錄的 transaction id 去 check相應的 undo segment header 中 slot 的狀態),也就是說對於其他 session 而言,這個事務已經 commit 了,雖然這個事務其實並沒有成功commit。
(解除掛起lgwr程式,可以使用oradebug resume)
session 4:shutdown abort之後startup啟動例項
SYS@PROD>shutdown abort;
SYS@PROD>startup;

告警日誌顯示有instance recovery
session 1:再次檢視test表,資料不存在。
SCOTT@PROD>conn scott/tiger
SCOTT@PROD>select * from test;

SYS@PROD>oradebug help
HELP [command] Describe one or all commands
SETMYPID Debug current process
SETOSPID <ospid> Set OS pid of process to debug
SETORAPID <orapid> ['force'] Set Oracle pid of process to debug
SETORAPNAME <orapname> Set Oracle process name to debug
SHORT_STACK Get abridged OS stack
CURRENT_SQL Get current SQL
DUMP <dump_name> <lvl> [addr] Invoke named dump
DUMPSGA [bytes] Dump fixed SGA
DUMPLIST Print a list of available dumps
EVENT <text> Set trace event in process
SESSION_EVENT <text> Set trace event in session
DUMPVAR <p|s|uga> <name> [level] Print/dump a fixed PGA/SGA/UGA variable
DUMPTYPE <address> <type> <count> Print/dump an address with type info
SETVAR <p|s|uga> <name> <value> Modify a fixed PGA/SGA/UGA variable
PEEK <addr> <len> [level] Print/Dump memory
POKE <addr> <len> <value> Modify memory
WAKEUP <orapid> Wake up Oracle process
SUSPEND Suspend execution
RESUME Resume execution
FLUSH Flush pending writes to trace file
CLOSE_TRACE Close trace file
TRACEFILE_NAME Get name of trace file
LKDEBUG Invoke global enqueue service debugger
NSDBX Invoke CGS name-service debugger
-G <Inst-List | def | all> Parallel oradebug command prefix
-R <Inst-List | def | all> Parallel oradebug prefix (return output
SETINST <instance# .. | all> Set instance list in double quotes
SGATOFILE <SGA dump dir> Dump SGA to file; dirname in double quotes
DMPCOWSGA <SGA dump dir> Dump & map SGA as COW; dirname in double quotes
MAPCOWSGA <SGA dump dir> Map SGA as COW; dirname in double quotes
HANGANALYZE [level] [syslevel] Analyze system hang
FFBEGIN Flash Freeze the Instance
FFDEREGISTER FF deregister instance from cluster
FFTERMINST Call exit and terminate instance
FFRESUMEINST Resume the flash frozen instance
FFSTATUS Flash freeze status of instance
SKDSTTPCS <ifname> <ofname> Helps translate PCs to names
WATCH <address> <len> <self|exist|all|target> Watch a region of memory
DELETE <local|global|target> watchpoint <id> Delete a watchpoint
SHOW <local|global|target> watchpoints Show watchpoints
DIRECT_ACCESS <set/enable/disable command | select query> Fixed table access
CORE Dump core without crashing process
IPC Dump ipc information
UNLIMIT Unlimit the size of the trace file
PROCSTAT Dump process statistics
CALL [-t count] <func> [arg1]...[argn] Invoke function with arguments
SYS@PROD>
呂星昊
2016.3.27
來自 “ ITPUB部落格 ” ,連結:http://blog.itpub.net/29475508/viewspace-2064711/,如需轉載,請註明出處,否則將追究法律責任。
相關文章
- ORACLE資料庫事務隔離級別Oracle資料庫
- 資料庫事務與事務的隔離級別資料庫
- 資料庫事務與隔離級別資料庫
- 資料庫事務隔離資料庫
- Oracle資料庫事務隔離級別概述Oracle資料庫
- 【Oracle】-【體系結構-LGWR】-LGWR的一些理解Oracle
- 資料庫事務與隔離級別示例(oracle與sql server對比)資料庫OracleSQLServer
- 資料庫事務隔離級別資料庫
- MySQL資料庫事務隔離性的實現MySql資料庫
- Oracle-事務隔離級別Oracle
- oracle資料庫事務不同事務隔離級別與v$transaction flag列思考Oracle資料庫
- 資料庫事務及其隔離級別資料庫
- 成為MySQL DBA後,再看ORACLE資料庫(十、事務與隔離級別)MySqlOracle資料庫
- MySQL事務隔離MySql
- MySQL 事務隔離MySql
- 聊聊資料庫的事務隔離級別資料庫
- Mysql鎖與事務隔離級別MySql
- 事務系統的隔離級別
- 事務隔離(二):基於加鎖方式的事務隔離原理
- [譯] SQL 事務隔離實用指南SQL
- 深入理解oracle的事務隔離性Oracle
- 檢視ORACLE事務隔離級別方法Oracle
- [資料庫]事務的4種隔離級別資料庫
- MySQL資料庫引擎、事務隔離級別、鎖MySql資料庫
- 資料庫事務隔離級別分析----轉載資料庫
- 資料庫事務的四種隔離級別資料庫
- SqlServer事務詳解(事務隔離性和隔離級別詳解)SQLServer
- 事務ACID特性與隔離級別
- [DB2]原創--實戰式體驗事務隔離級別之UR篇DB2
- MySQL 事務隔離級別實現原理MySql
- KES資料庫實踐指南:探索KES資料庫的事務隔離級別資料庫
- 資料庫系列:事務的4種隔離級別資料庫
- MySQL 事務隔離級別MySql
- 4.MySQL--事務隔離MySql
- PostgreSQL事務隔離級別SQL
- 事務、特性、隔離級別
- PostgreSQL的事務隔離分析SQL
- MySQL事務隔離級別MySql