phpstorm對於使用PHP開發web的人員來說,是一個非常不錯的編輯開發IDE,以前用過sublime,但是相比於storm,sublime在瀏覽legacy程式碼,類程式碼編輯方面明顯要遜色不少。同時其程式碼除錯功能是我見過的web開發IDE中是最棒的!傾情推薦。對應的webstorm對於js開發也是非常棒!
project->setting->Autoscroll to source、from source選中即可實現sublime一樣單點就開啟檔案瀏覽的工作模式,同時你在editor中的檔案對應會在project navigation window中開啟對應的資料夾,很方便。

上述設定無法儲存,如果需要儲存,則需要安裝Autoscroll Save plugin
http://phpstorm.tips/tips/8-jump-to-matching-brace
alt+home - 彈出當前目錄以供操作
alt+insert - 目錄context時, 在選中的目錄中彈出建立...對話方塊
alt+insert - 檔案內容context時,彈出建立construct,phpdoc等對話方塊,這時如果alit+enter則會提示initialize class 的fields
ctrl+w - 持續選擇括號,方括號,tag內容,不斷擴充套件, 非常好用!!!在sublime中必須通過擴充套件plugin來實現的
ctrl+d - 選擇游標所在詞,持續向下選擇next occurence
ctrl+alt+左箭頭 -直接返回最近前一次游標所在位置(也可以是多個檔案哦)
ctrl+alt+右箭頭 -直接返回最近後一次游標所在位置(也可以是多個檔案哦)
ctrl+shitf+d -取消當前選擇到的occurence
ctrl+shift+o - 瀏覽查詢global symbol
ctrl+shift+N - 游標移動到matching brace(Moving caret to the matched brace)
alt+左鍵 - 多游標設定
shift+c -跳到程式碼code start的地方
shift+x -跳到程式碼code end的地方
alt + Up - previous method in current class
alt + Down - Next method in current class
ctrl + shift +F7 - highlight all the symbol usage in current file
alt+V - vertical split into two display window
alt+C - close active editor window
ctrl+E - recent files,可以快速在瀏覽過的檔案中切換
ctrl+shift+E -recently changed files,列出最近修改過的檔案
shift+enter -直接到下一行
/** + enter -為下面的程式碼加註釋doc
ctrl+R -瀏覽類的成員,再次ctrl+R列出包含繼承過來的成員
shift +s - toggle status bar
live template - 在自己的程式碼視窗中選中希望重用的程式碼,ctrl+shift+p, search live template, 選擇save as live template即可使用
Mark changed file: file >> settings >> Editor >> Editor Tabs. Check Mark modified tabs with asterisk Click ok
phpStorm的auto save功能有時比較煩人,但是又沒有好的方法來關閉,比較可行的方式是首先開啟修改後mark為*的功能,隨後可以在local history中選擇變更
- Settings / Appearance & Behavior / System Settings / Save file on frame deactivation: unchecked
- Settings / Appearance & Behavior / System Settings / Save files automatically if...: unchecked
- Settings / Editor / General / Editor tabs / Mark modified tabs with asterisk :checked
alt+ H: local history
dependency injection自動新增成員變數到
php --ini :列出本機php所使用的ini檔案
http -S: 列出appache所使用conf檔案
[root@AY130628135803343949Z]# httpd -S
httpd: Could not reliably determine the server's fully qualified domain name, using 10.160.37.203 for ServerName
VirtualHost configuration:
127.0.0.1:10083        is a NameVirtualHost
         default server localhost (/etc/httpd/conf.d/zendserver_gui.conf:6)
         port 10083 namevhost localhost (/etc/httpd/conf.d/zendserver_gui.conf:6)
wildcard NameVirtualHosts and _default_ servers:
*:80                   is a NameVirtualHost
         port 80 namevhost www.xxxx.cn (/usr/local/zend/etc/sites.d/vhost_xxx.conf:1)
Syntax OK
https://confluence.jetbrains.com/display/PhpStorm/Remote+debugging+in+PhpStorm+via+SSH+tunnel
https://confluence.jetbrains.com/display/PhpStorm/Working+with+Remote+PHP+Interpreters+in+PhpStorm
https://confluence.jetbrains.com/display/PhpStorm/Working+with+Advanced+Vagrant+features+in+PhpStorm
下面的資源是適用於laravel的Live templates
https://github.com/koomai/phpstorm-laravel-live-templates
debugging PHP with phpstorm
http://blog.jetbrains.com/phpstorm/2013/07/webinar-recording-debugging-php-with-phpstorm/
https://confluence.jetbrains.com/display/PhpStorm/Zero-configuration+Web+Application+Debugging+with+Xdebug+and+PhpStorm
Homestead+phpstorm remote debugging配置要點
遠端除錯的一般知識
也可以參考http://www.cnblogs.com/JeffreySun/p/4877395.html
1. 安裝bookmark https://www.jetbrains.com/phpstorm/marklets/
2. Start Listening for PHP Debug Connections in PHPSTORM以便開始偵聽debug請求
2.a: project->settings(ctrl+alt+s)->deployment增加一個描述如何deploy你的server的profile,配置sftp資訊,配置path mapping(IDE to remote server)


關於path mapping,這篇文章有很詳細的描述: http://blog.jetbrains.com/webide/2011/03/configure-php-debugging-in-phpstorm-2-0/
2.b: project->settings(ctrl+alt+s)->PHP->Servers選擇上面的profile

3.可選在phpstorm中選擇stop at the first line:在php程式碼第一行就暫停
3.在phpstorm中增加breakpoint
4.增加一個debug configuration,以方便在PHPStorm中直接快速執行debug命令

4.a執行run->debug xxx將啟動一個預設瀏覽器,並且傳遞http://homestead.app:8000/?XDEBUG_SESSION_START=17769引數給homestead server,由xdebug捕捉到並且方向連線到PHPSTORM監聽的除錯埠9000,如果首次除錯,則需要再PHPSTORM中點選接受除錯請求,啟動除錯雙向連線
4.b如果在bookmarklet安裝的情況下,可以直接在瀏覽器中點選start debug this page按鈕,瀏覽器就可以向phpstorm的debug監聽介面發起請求
但是注意如果我們在file->settings->php->debug配置選項中勾選ignore external connections through unregistered server configuations,那麼由於我們的homestead住在防火牆後面(使用8000埠),在 4.a模式下我們向homestead.app:8000埠通過get引數發起debug引擎啟動請求,而隨後homestead的web server又反向向phpstorm請求除錯連線(注意這個回來的server_host引數是homestead.app:80埠!!!!)時,server host是不一樣的,因此在上述debug配置選項的情況下,PHPStorm是會忽略debug連線請求的!!(9000埠)。
相反,如果我們沒有勾選上面的選項,則phpstorm會提示我們是否接受來自homestead.app:80伺服器來的除錯請求,一旦我們接受,我們的phpstorm中就將增加了另外一個php server,而我們須要在這個server中配置path mapping,否則將可能無法hit breakpoint!(即便是通過xdebug_break()主動斷點是工作的!),在debug介面會一直報file path is not mapped to any file path on server的錯誤(其原因就是無註冊的server相匹配)。
IDE正常中斷點的前提是當IDE偵聽除錯連線時,在php程式中的xdeubg_break()能夠主動斷掉!


5.reload這個page
5.a為了驗證debug環境是否已經ok,可以通過在Php程式碼中人為增加一條xdebug程式碼: xdebug_break(); 隨後瀏覽器訪問伺服器執行該程式碼,那麼就應該觸發IDE的breakpoint!!
有時你在php配置使能xdebug功能時,可能找不到相應的php.ini配置檔案,方法是php --ini,這個命令就會列出系統的php到底使用的是哪一個php.ini檔案
6.點選start debug將由browser初始化一個debug session並且向phpstorm發起請求
xdebug.ini中 remote_host = 192.168.56.1 這條可以由xdebug.remote_connect_back = 1來替代,增加一條 xdebug.idekey = "PHPSTORM", 這個資訊是phpstorm中所需要的(在需要支援多個除錯session時由debug proxy所需要)
隨後重啟vagrant中的web服務: sudo service php5-fpm restart
http://www.sitepoint.com/install-xdebug-phpstorm-vagrant/
如果在debug過程中,瀏覽器60s就會timeout,可以在/etc/nginx/nginx.conf中增加fastcgi_read_timeout 3600s;另外一個引數:
fastcgi_read_timeout 3600s;
fastcgi_connect_timeout 300s;
fastcgi_send_timeout 300s;
對於apache,我們直接在httpd.conf檔案中加入:
Timeout 5000
即刻解決30秒左右http請求就被kill掉的問題,隨意除錯吧!
參考以下連結:xdebug配置
https://netbeans.org/kb/docs/php/configure-php-environment-windows.html
如何使用profiler功能?
PHPStorm本身並不具備profiler功能,它主要完成對xdebug輸出的profiler檔案做分析。如何開啟profiler功能呢?在php.ini檔案中增加兩行(一般在xdebug.ini中定義):
xdebug.profiler_enable = 1
xdebug.profiler_output_dir = "/home/vagrant/Code"
隨後執行sudo service php5-fpm restart即可。這時一旦執行任何一個url,則會在/home/vagrant/Code目錄下生成相應的檔案,這個檔案在phpstorm的tools->analyze profiler file中分析,或者你也可以使用QCachegrind(windows),KCachegrind來做專業分析
http://sourceforge.net/projects/wincachegrind/ 分析器

execution trace(function trace)
如果你是專案的新加入者,對於系統是如何工作的沒有清晰地瞭解,希望通過研究系統整個運作流程,那麼使用xdebug的execution trace功能非常有幫助
xdebug.collect_params = 4 (最全的資訊)
xdebug.collect_return = 1
xdebug.trace_format = 2 (2為html, 0為一般可讀,1為機讀)
xdebug_start_trace() xdebug_stop_trace()
function trace檔案分析工具:
https://github.com/beberlei/xdebug-trace-gui

| Category | Setting | Values | Description | |
|---|---|---|---|---|
| Log file |
xdebug.trace_output_dir |
|||
| xdebug.trace_output_name |
||||
| xdebug.trace_options |
1 = append to trace file if it exists. 0 (default) = overwrite |
|||
| Select data per call |
xdebug.collect_params |
Non-zero = collect parameters passed to functions
|
||
| xdebug.collect_return |
1 = write return values to trace file. Default 0 |
|||
| xdebug.collect_vars |
1 = analyze variables used in scope (slow). |
|||
| xdebug.collect_assignments |
1 = include variable assignments in execution traces |
|||
| Format |
xdebug.trace_format |
|
||
| xdebug.show_mem_delta |
1 = show mem delta for each call |
|||
| Behavior |
xdebug.auto_trace |
1 = enable trace just before script runs. Includes the auto_prepend_file |
||
| xdebug.trace_enable_trigger |
1 = trigger trace using XDEBUG_TRACE GET/POST parameter, or set cookie XDEBUG_TRACE. To prevent Xdebug generating trace files for every request, set xdebug.auto_trace to 0. (Could not get this to work. This setting doesn't seem to be used in the XDebug source code.) Doh! See: [xdebug-general] Re: Is trace_enable_trigger defunct? Not implemented in Xdebug 2.1.2! |
|||
| Limits |
xdebug.var_display_max_depth |
Max levels of array elements and object properties that are displayed in trace output. Default 3. |
||
| xdebug.var_display_max_data |
Max string length for output of variables. Default 512. |
|||
| xdebug.var_display_max_children |
Max number of array children and object properties that are displayed in trace output. Default 128 |
|||
Functions to call in the PHP subject code
| Category | Function | Description |
|---|---|---|
| ini_set() |
Sets the value of a configuration option. I.e., substitute or override for settings in php.ini file. http://www.php.net/manual/en/function.ini-set.php |
|
| void xdebug_start_trace( string trace_file_path [, integer options] ) |
Start tracing at this line of code. Trace file path is absolute, or relative to cwd. If no path given (empty string? No arg?) then xdebug uses setting xdebug.trace_output_dir. options is a bitmap:
|
|
| void xdebug_stop_trace() |
Stop tracing and close output file. |
|
| string xdebug_get_tracefile_name() |
Get name of output file. Useful in conjunction with xdebug.auto_trace, apparently. |
|
| Data display functions |
Are these relevant? Where does their output go? |
|
| xdebug_var_dump() |
||
| xdebug.show_local_vars |
auto namespacing
在編寫PHP類程式碼過程中,如果使用了namespace,那麼每次新建立類檔案時需要指定namespace,同時為了使用composer的autoload功能,你又必須遵循PSR-4的目錄佈置及命名規範,這一點是比較繁瑣的。PhpStorm可以解決這個問題,具體配置方式如下圖:

一旦配置完成後,後續在IDE中建立新的PHP Class時,IDE自動新增符合PSR-4規範的namespace!
自動插入PHP use statements
在寫php程式碼時,由於有namespace的存在,引用一個類感覺是很囉嗦的,好在phpstorm已經替我們想到了這個pain point,游標在一個類名時,只要alt+enter選擇import class就會自動插入use xxxClass到檔案頭部很方便
https://www.youtube.com/watch?v=LUTolQw8K9A
https://www.jetbrains.com/phpstorm/documentation/phpstorm-video-tutorials.jsp#10
http://stackoverflow.com/questions/15339165/cannot-debug-with-phpstorm-vagrant-xdebug
https://confluence.jetbrains.com/display/PhpStorm/Remote+debugging+in+PhpStorm+via+SSH+tunnel
PHPStorm XMX out of memory問題:
在大型專案中,由於構建index需要使用大量記憶體,這時很有可能會發生JVM heap記憶體不夠的情況,解決辦法:
修改檔案C:\Program Files (x86)\JetBrains\PhpStorm 4.0.2\bin\PhpStorm.exe.vmoptions
-Xms128m
-Xmx1024m
-XX:MaxPermSize=250m
-XX:ReservedCodeCacheSize=64m
-ea
使用typehinting讓phpstorm更加聰明
在程式碼編寫中,如果我們自己知道一個variable是什麼class,這樣我們如果再通過以下方法做下type hinting, PHPSTORM就能夠學習到這個變數的所有方法和屬性,這樣當你使用這個變數時便能夠自動補充程式碼,這樣就能夠大大提高編碼速度和準確度
        /* @var \App\User $usertocheck */
        $usertocheck = $user?$user:$this->app->auth->user();

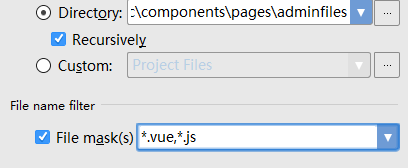
如何針對資料夾下面特定字尾名的檔案來搜尋?
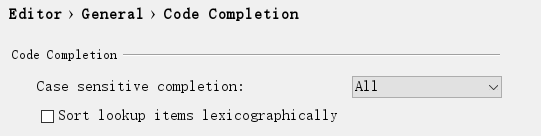
pycharm配置對應code completion提示
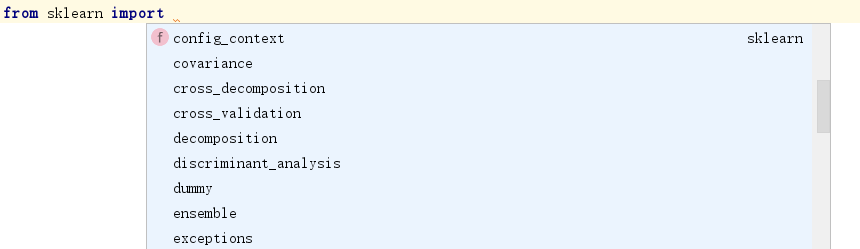
我們選擇使用IDE環境而不是python命令列方式開發程式碼,很重要一點是希望能夠高產高效。其中code completion就是很重要的一點,我們希望在知道零星資訊或者全然不知任何程式碼知識的前提下IDE能夠激發我們的想象並選擇,這時code completion的功能就十分強大了。相關的配置及使用方式,配置上有一個code completion的觸發方式,預設是首字母,我們可以選擇全場景下應用程式碼智慧補全,設定好後,對應的程式碼補全快捷鍵是:
Default completion shortcuts:
- Basic: Ctrl+Space
- SmartType: Ctrl+Shift+Space
- Class Name: Ctrl+Alt+Space
效果圖: