D3 layouts help you create more advanced visualisations such as treemaps:
D3 layouts幫助您創造更加高階複雜的視覺化圖表,比如treemaps,packed circles,network graphs:

Layout is just a JavaScript function that takes your data as input and adds visual variables such as position and size to it.
一句話: layout就是一個接收你的data作為輸入,而經過變換增加類似位置,大小等視覺化變數到這個data上去的函式
比如tree layout就接收一個層次化的結構資料,而對每個node增加x,y座標,這樣這些節點就形成一個類樹的圖形:

D3有很多中hierarchy layouts(處理層次化資料)和chord layout(處理網路資訊流向)和一個通用的force layout(物理現象的模擬)。
注意:你也可以建立你自己的layout.比如你可以建立一個簡單的函式,該函式僅僅給源data陣列新增位置資訊,這樣的函式就可以被認為是一個layout
Hierarchical layouts
我們來看下面的層次化資料:
{"name":"A1","children":[{"name":"B1","children":[{"name":"C1","value":100},{"name":"C2","value":300},{"name":"C3","value":200}]},{"name":"B2","value":200}]}在這節裡我們將來看看tree, cluster, treemap, pack和partition layout.注意:treemap, pack和partition被用於layout(轉換)層次關係,這種層次關係圖表中節點nodes有一個關聯的數字值(比如:銷售額,人口數量等).
D3 V4要求層次化輸入資料規整後必須以d3.hierarchy物件的形式存在,這一點下面做詳細介紹。
d3.hierarchy
一個d3.hierarchy object 是一種可以表達層次關係的資料結構。該object有一些實現獲取比如:ancestor, descendant, leaf nodes資訊(用於計算nodes之間的連線path)的預定義方法。物件本身可以通過d3.hierarchy(data)來生成。
var data = {
  "name": "A1",
  "children": [
    {
      "name": "B1",
      "children": [
        {
          "name": "C1",
          "value": 100
        },
        {
          "name": "C2",
          "value": 300
        },
        {
          "name": "C3",
          "value": 200
        }
      ]
    },
    {
      "name": "B2",
      "value": 200
    }
  ]
}

var root = d3.hierarchy(data)
一般情況下你不必直接對該hierarchy object操作,但是可以使用其定義的一些方法,比如:
root.descendants();
root.links()
root.descendants() 返回一個扁平的陣列來表達root的子孫後代,而root.links()則返回一個扁平的物件陣列來表達所有的父子links
More examples of hierarchy functions
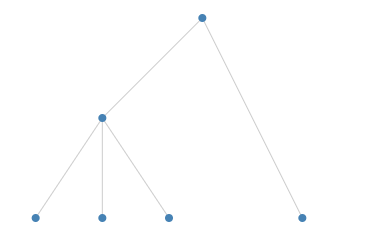
tree layout
tree layout將層級關係中的節點安排成一個tree like arrangement.

我們通過下面的程式碼首先來建立一個tree
var treeLayout = d3.tree();
我們使用.size()來配置tree的
treeLayout.size([400, 200]);
隨後我們可以呼叫treeLayout函式,傳入我們的hierarchy object root:
treeLayout(root);這個函式執行的結果是會將root的每一個node都增加上x和y的value
接著,我們可以:
- 使用
root.descendants()來得到所有節點的一個陣列 - 將這個陣列data join到circles(或者任何其他的svg element)
- 使用layout產生的x,y來給每個節點定位其座標位置
並且。。。
- 使用
root.links()來獲得所有links陣列 - 將links陣列join到line (or path) elements
- 使用link的source和target的x,y座標值來畫出每個line(也就是設定其d屬性)
(注意root.links() 每一個陣列元素都是一個包含了代表link的source和target的物件)
// Nodes
d3.select('svg g.nodes')
  .selectAll('circle.node')
  .data(root.descendants())
  .enter()
  .append('circle')
  .classed('node', true)
  .attr('cx', function(d) {return d.x;})
  .attr('cy', function(d) {return d.y;})
  .attr('r', 4);

// Links
d3.select('svg g.links')
  .selectAll('line.link')
  .data(root.links())
  .enter()
  .append('line')
  .classed('link', true)
  .attr('x1', function(d) {return d.source.x;})
  .attr('y1', function(d) {return d.source.y;})
  .attr('x2', function(d) {return d.target.x;})
  .attr('y2', function(d) {return d.target.y;});

cluster layout
cluster layout 和 tree layout 是很相似的,主要的區別是所有的葉子節點都將放置在相同的深度
<svg width="400" height="220">
    <g transform="translate(5, 5)">
      <g class="links"></g>
      <g class="nodes"></g>
    </g>
  </svg>
var data = {
  "name": "A1",
  "children": [
    {
      "name": "B1",
      "children": [
        {
          "name": "C1",
          "value": 100
        },
        {
          "name": "C2",
          "value": 300
        },
        {
          "name": "C3",
          "value": 200
        }
      ]
    },
    {
      "name": "B2",
      "value": 200
    }
  ]
}

var clusterLayout = d3.cluster()
  .size([400, 200])

var root = d3.hierarchy(data)

clusterLayout(root)

// Nodes
d3.select('svg g.nodes')
  .selectAll('circle.node')
  .data(root.descendants())
  .enter()
  .append('circle')
  .classed('node', true)
  .attr('cx', function(d) {return d.x;})
  .attr('cy', function(d) {return d.y;})
  .attr('r', 4);

// Links
d3.select('svg g.links')
  .selectAll('line.link')
  .data(root.links())
  .enter()
  .append('line')
  .classed('link', true)
  .attr('x1', function(d) {return d.source.x;})
  .attr('y1', function(d) {return d.source.y;})
  .attr('x2', function(d) {return d.target.x;})
  .attr('y2', function(d) {return d.target.y;});
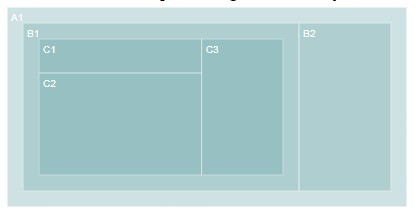
treemap layout
Treemaps用於視覺化地代表層級關係,每個item都有一個相關的value
比如,我們可以將世界人口資料視作層次化的:第一級代表region,第二級代表各個country.一個treemap通過一個矩形代表一個國家(矩形的大小則和其人口數量大小成比例),而最終將每個region組合在一起:

var treemapLayout = d3.treemap();treemapLayout
.size([400, 200])
.paddingOuter(10);需要注意的是:在我們應用layout到我們的 hierarchy 之前,我們必須先執行 .sum() 在hierarchy上. 這個方法將遍歷整顆樹,並且在每個節點上設定.value以代表該節點下的所有子節點的數值之和
var root = d3.hierarchy(data)root.sum(function(d) {
return d.value;
});需要注意的是我們給.sum()傳入了一個accessor function以便指定我們要對哪個屬性來做sum操作.
我們現在可以呼叫treemapLayout函式來對hierarchy object做轉換:
treemapLayout(root);這時layout將新增4個屬性x0,x1,y0,y1到每個節點上去,而這些值將指定treemap中每個矩形的大小尺寸。
現在我們就可以將layout的輸出轉換資料用於視覺化了,方法是:將rect和layout data join起來,隨後更新其x,y,width,height屬性:
d3.select('svg g')
  .selectAll('rect')
  .data(root.descendants())
  .enter()
  .append('rect')
  .attr('x', function(d) { return d.x0; })
  .attr('y', function(d) { return d.y0; })
  .attr('width', function(d) { return d.x1 - d.x0; })
  .attr('height', function(d) { return d.y1 - d.y0; })
如果我們希望對每個矩形增加label,我們可以join g 元素到這個layout data,並且增加rect和text元素到每個g元素中。
var nodes = d3.select('svg g')
  .selectAll('g')
  .data(rootNode.descendants())
  .enter()
  .append('g')
  .attr('transform', function(d) {return 'translate(' + [d.x0, d.y0] + ')'})

nodes
  .append('rect')
  .attr('width', function(d) { return d.x1 - d.x0; })
  .attr('height', function(d) { return d.y1 - d.y0; })

nodes
  .append('text')
  .attr('dx', 4)
  .attr('dy', 14)
  .text(function(d) {
    return d.data.name;
  })
完整的程式碼及效果如下:
  <svg width="420" height="220">
    <g></g>
  </svg>
var data = {
  "name": "A1",
  "children": [
    {
      "name": "B1",
      "children": [
        {
          "name": "C1",
          "value": 100
        },
        {
          "name": "C2",
          "value": 300
        },
        {
          "name": "C3",
          "value": 200
        }
      ]
    },
    {
      "name": "B2",
      "value": 200
    }
  ]
};

var treemapLayout = d3.treemap()
  .size([400, 200])
  .paddingOuter(16);

var rootNode = d3.hierarchy(data)

rootNode.sum(function(d) {
  return d.value;
});

treemapLayout(rootNode);

var nodes = d3.select('svg g')
  .selectAll('g')
  .data(rootNode.descendants())
  .enter()
  .append('g')
  .attr('transform', function(d) {return 'translate(' + [d.x0, d.y0] + ')'})

nodes
  .append('rect')
  .attr('width', function(d) { return d.x1 - d.x0; })
  .attr('height', function(d) { return d.y1 - d.y0; })

nodes
  .append('text')
  .attr('dx', 4)
  .attr('dy', 14)
  .text(function(d) {
    return d.data.name;
  })
treemap layouts 還可以有以下配置方法:
- the padding around a node’s children can be set using
.paddingOuter - the padding between sibling nodes can be set using
.paddingInner - outer and inner padding can be set at the same time using
.padding - the outer padding can also be fine tuned using
.paddingTop,.paddingBottom,.paddingLeftand.paddingRight.
var treemapLayout = d3.treemap()
  .size([400, 200])
  .paddingTop(20)
  .paddingInner(2);
在上面的程式碼中, paddingTop is 20 and paddingInner is 2.
Treemaps也可以使用不同的平鋪策略,d3js本身提供以下幾種內建的策略可供選用 (treemapBinary, treemapDice, treemapSlice, treemapSliceDice, treemapSquarify) 這些策略通過 .tile()來選擇:
treemapLayout.tile(d3.treemapDice)treemapBinary strives for a balance between horizontal and vertical partitions, treemapDice partitions horizontally, treemapSlice partitions vertically, treemapSliceDice alternates between horizontal and vertical partioning and treemapSquarify allows the aspect ratio of the rectangles to be influenced.

The effect of different squarify ratios can be seen here.
pack layout
pack layout和tree layout是類似的,只是我們使用circles而不是rects來代表一個節點而已. 在下面的例子中,每個country都由一個圓來代替(其半徑的大小對應著相應的population)而所有國家以region來做分組.

var packLayout = d3.pack();packLayout.size([300, 300]);和treemap一樣,我們必須在hierarchy object root被pack layout呼叫之前,在該物件上呼叫 .sum()以便獲取彙總資料:
rootNode.sum(function(d) {
  return d.value;
});

packLayout(rootNode);
pack layout 為每個node增加了x,y和r屬性。
現在我們就可以將layout轉換後的結果資料和circle元素join起來從而實現視覺化。為root的每一個descendant增加一個circle元素。
d3.select('svg g')
  .selectAll('circle')
  .data(rootNode.descendants())
  .enter()
  .append('circle')
  .attr('cx', function(d) { return d.x; })
  .attr('cy', function(d) { return d.y; })
  .attr('r', function(d) { return d.r; })
類似地,也可以通過g元素來組合circle以及對應的labels:
var nodes = d3.select('svg g')
  .selectAll('g')
  .data(rootNode.descendants())
  .enter()
  .append('g')
  .attr('transform', function(d) {return 'translate(' + [d.x, d.y] + ')'})

nodes
  .append('circle')
  .attr('r', function(d) { return d.r; })

nodes
  .append('text')
  .attr('dy', 4)
  .text(function(d) {
    return d.children === undefined ? d.data.name : '';
  })
我們可以使用 .padding()來配置每個圓之間的padding
packLayout.padding(10)<svg width="320" height="320"> <g></g> </svg>
var data = {
  "name": "A1",
  "children": [
    {
      "name": "B1",
      "children": [
        {
          "name": "C1",
          "value": 100
        },
        {
          "name": "C2",
          "value": 300
        },
        {
          "name": "C3",
          "value": 200
        }
      ]
    },
    {
      "name": "B2",
      "value": 200
    }
  ]
};

var packLayout = d3.pack()
  .size([300, 300])
  .padding(10)

var rootNode = d3.hierarchy(data)

rootNode.sum(function(d) {
  return d.value;
});

packLayout(rootNode);

var nodes = d3.select('svg g')
  .selectAll('g')
  .data(rootNode.descendants())
  .enter()
  .append('g')
  .attr('transform', function(d) {return 'translate(' + [d.x, d.y] + ')'})

nodes
  .append('circle')
  .attr('r', function(d) { return d.r; })

nodes
  .append('text')
  .attr('dy', 4)
  .text(function(d) {
    return d.children === undefined ? d.data.name : '';
  })
partition layout
partition layout 將一個矩形區域針對每一個層級都細分為一層。每一層針對本層裡面每一個節點再做細分。D3’s partition layout is created using:

var partitionLayout = d3.partition();partitionLayout.size([400, 200]);rootNode.sum(function(d) {
return d.value;
});
partitionLayout(rootNode);partition layout 將對每個node增加 x0, x1, y0 and y1 屬性.
現在我們就可以給root的每個後代新增對應的rect元素並且修改其屬性。
d3.select('svg g') .selectAll('rect') .data(rootNode.descendants()) .enter() .append('rect') .attr('x', function(d) { return d.x0; }) .attr('y', function(d) { return d.y0; }) .attr('width', function(d) { return d.x1 - d.x0; }) .attr('height', function(d) { return d.y1 - d.partitionLayout.padding(2)
如果我們希望修改分割槽的排列方向,我們可以在定義rect元素的屬性時,swap x0,y0,x1,y1:
  .attr('x', function(d) { return d.y0; })
  .attr('y', function(d) { return d.x0; })
  .attr('width', function(d) { return d.y1 - d.y0; })
  .attr('height', function(d) { return d.x1 - d.x0; });
我們也可以將x對映成一個旋轉的角度,而y對映成半徑長度,這樣建立一個旭日分割槽:
  <svg width="320" height="320">
    <g transform="translate(160, 160)"></g>
  </svg>
var data = {
  "name": "A1",
  "children": [
    {
      "name": "B1",
      "children": [
        {
          "name": "C1",
          "value": 100
        },
        {
          "name": "C2",
          "value": 300
        },
        {
          "name": "C3",
          "value": 200
        }
      ]
    },
    {
      "name": "B2",
      "value": 200
    }
  ]
};

var radius = 150;

var partitionLayout = d3.partition()
  .size([2 * Math.PI, radius]);

var arcGenerator = d3.arc()
  .startAngle(function(d) { return d.x0; })
  .endAngle(function(d) { return d.x1; })
  .innerRadius(function(d) { return d.y0; })
  .outerRadius(function(d) { return d.y1; });

var rootNode = d3.hierarchy(data)

rootNode.sum(function(d) {
  return d.value;
});

partitionLayout(rootNode);

d3.select('svg g')
  .selectAll('path')
  .data(rootNode.descendants())
  .enter()
  .append('path')
  .attr('d', arcGenerator);
chord layout
Chord圖將一組節點之間的關係連結進行視覺化。每個link都有關聯的value. 比如我們可以列出不同國家之間的人口遷徙關係圖
原始資料是一個矩陣 n x n (n是元素的個數):
var data = [
  [10, 20, 30],
  [40, 60, 80],
  [100, 200, 300]
];
第一行代表著從第一個item flows到第1,第2,第3個item。
第二行代表著從第二個item flows到第1,第2,第3個item。
我們通過chord()呼叫來建立layout
var chordGenerator = d3.chord();使用.padAngle() (鄰近的組之間的padding angle in radians), .sortGroups() (指定組出現的順序), .sortSubgroups() (在每個group內部的分類) 而 .sortChords() 定義了z order of the chords.
var chords = chordGenerator(data);返回chords陣列. 陣列的每一個元素都是一個包含了source 和 target屬性的物件. 每一個source和target都有著startAngle 和endAngle 屬性,這將用於定義每個chord
隨後我們使用ribbon shape generator(路徑生成器,和line, arc generator相對應) 將chord屬性轉換為path d屬性 (see the Shapes chapter for more information on shape generators).
var ribbonGenerator = d3.ribbon().radius(200);

d3.select('g')
  .selectAll('path')
  .data(chords)
  .enter()
  .append('path')
  .attr('d', ribbonGenerator)
  <svg width="500" height="500">
    <g transform="translate(250, 250)"></g>
  </svg>
var chordGenerator = d3.chord()
  .sortSubgroups(d3.ascending)
  .padAngle(0.04);

var ribbonGenerator = d3.ribbon().radius(200);

var data = [
  [10, 20, 30],
  [40, 60, 80],
  [100, 200, 300]
];

var chords = chordGenerator(data);

d3.select('g')
  .selectAll('path')
  .data(chords)
  .enter()
  .append('path')
  .attr('d', ribbonGenerator)