記一次資料庫的分析和優化建議
資料庫的巡檢是DBA工作中的一部分,有時候我們還是希望能夠在巡檢的基礎上發現一些潛在的問題,把儘可能多的問題解決在初始階段。
今天來給大家舉一個資料庫巡檢和效能分析的例子。
首先拿到一個資料庫伺服器,瞭解系統資訊是必要的,同時還要分析資料庫的資訊,然後儘可能發現是否存在效能瓶頸,然後需要做一個對比的分析。
系統資訊
$ cat /etc/issue
Red Hat Enterprise Linux Server release 5.3(Tikanga)
Kernel \r on an \m
$ ksh cpuinfo.sh
**************************************
CPU Physical NO: 2
CPU Processor NO: 16
CPU Core NO: cpu cores : 4
CPU model name : Intel(R) Xeon(R) CPU E5620@ 2.40GHz
**************************************
top - 10:39:48 up 389 days, 2:28, 1 user, load average: 0.91, 0.91,0.80
Tasks: 1370 total, 1 running, 1363 sleeping, 0 stopped, 6 zombie
Cpu(s): 1.2%us, 0.2%sy, 0.0%ni, 96.8%id, 1.6%wa, 0.0%hi, 0.2%si, 0.0%st
Mem: 65996212k total, 65820480k used, 175732k free, 530412k buffers
Swap: 16779884k total, 236k used, 16779648k free, 17410172kcached
Hugepage已經啟用了。
[oracle@acc136 bdump]$ cat /proc/meminfo | grep -i page
AnonPages: 4783576 kB
PageTables: 359020 kB
HugePages_Total: 20525
HugePages_Free: 60
HugePages_Rsvd: 16
Hugepagesize: 2048 kB
資料庫級資訊
資料庫是10gR2,2014年啟動至今
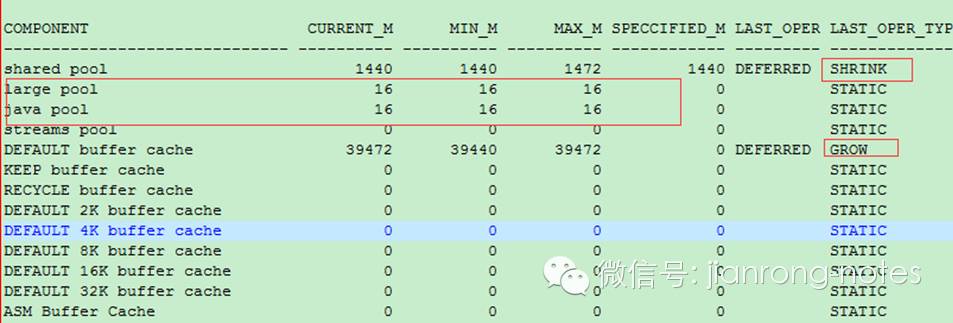
記憶體元件的使用情況
Cache Sizes
~~~~~~~~~~~ Begin End
--------------------
BufferCache: 39,472M 39,472M Std Block Size: 8K
SharedPool Size: 1,440M 1,440M Log Buffer: 14,256K
其它記憶體元件的大小
Session資訊的統計
鎖和事務情況
[oracle@acc136 yangjr]$ ksh showlock.sh
Current Locks
-------------
There are also 0 transaction locks
Blocking Session Details
Redo日誌切換頻率
表空間使用情況
常規檢查,就不貼圖了。
使用者資源使用情況
檢視資料庫中使用者資源的使用情況。常規檢查就不貼圖了。
近一週的資料庫負載圖表
針對兩個不同時段的效能抖動進行分析。
第一個效能抖動最劇烈的時間段,是在8月8日凌晨
等待事件如下,可以看到主要的效能瓶頸在於IO
CPU資源都消耗在sql部分。
Top sql如下:
Elapsed CPU Elap per % Total
Time (s) Time (s) Executions Exec (s) DB Time SQL Id
---------- ---------- ---------------------- ------- -------------
1,856 31 288,077 0.0 18.9 57j9uu7c9681a
Module: JDBC Thin Client
SELECT * FROM TEST_CN_BIND WHERE CN=:1 AND CN_TYPE IN(1,2,3) AND ENABLED='Y'ORDER BY
CN_TYPE
1,659 75 1,352 1.2 16.9 acbdxf552ud62
update TEST_USER_BILLING set LOGIN_STATUS = 1 where UIN = :1
1,162 328 1 1162.1 11.8 b6usrg82hwsa3
Module: DBMS_SCHEDULER
call dbms_stats.gather_database_stats_job_proc ( )
172,774 1,352 127.8 1.4 75.33 1659.42 acbdxf552ud62
update USER_BILLING set LOGIN_STATUS = 1 where UIN = :1
效能問題分析:
IO問題
從Oracle的角度來看,IO瓶頸較高,針對目前的情況,沒有更好的系統級改進建議
The throughput of the I/O subsystem wassignificantly lower than expected.
RECOMMENDATION 1: Host Configuration, 13% benefit (1258 seconds)
ACTION: Consider increasing the throughput of the I/O subsystem.
Oracle's recommended solution is to stripe all data file using the
SAME methodology. You might also need to increase the number of disks
for better performance. Alternatively, consider using Oracle's
Automatic Storage Management solution.
RATIONALE: During the analysis period, the average data files' I/O
throughput was 52 M persecond for reads and 2.1 M per second for
writes. The average response time for single block reads was 5.9
milliseconds.
後臺自動job執行
call dbms_stats.gather_database_stats_job_proc ( )
後臺job執行時,會根據條件進行統計資訊的收集。
從Top sql來看,大表test_user_billing的查詢acbdxf552ud62基於unique index scan,但是執行時間在1.4秒,主要的原因就是因為在執行期間同時在後臺進行統計資訊的收集。
從Oracle的建議可以看到其實做了一個全物件掃描,產生了大量的物理讀。
ACTION: Run "Segment Advisor" onTABLE "ACC.USER_BILLING" with object id
51864.
RELEVANT OBJECT: database object with id 51864
ACTION: Investigate application logic involving I/O on TABLE
"xxxx.TEST_USER_BILLING" with object id 51864.
RELEVANT OBJECT: database object with id 51864
RATIONALE: The I/O usage statistics for the object are: 1 full object
scans, 11827830 physicalreads, 459490 physical writes and 0 direct
reads.
RATIONALE: The SQL statement with SQL_ID "acbdxf552ud62" spent
significant time waiting for User I/O on the hot object.
RELEVANT OBJECT: SQL statement with SQL_ID acbdxf552ud62
update TEST_USER_BILLING set LOGIN_STATUS = 1 where UIN = :1
RATIONALE: The SQL statement with SQL_ID "92a49umxy7q8m" spent
significant time waiting for UserI/O on the hot object.
RELEVANT OBJECT: SQL statement with SQL_ID 92a49umxy7q8m
select /*+ no_parallel(t) no_parallel_index(t) dbms_stats
cursor_sharing_exact use_weak_name_resl dynamic_sampling(0)
no_monitoring */ count(*),count("CARD_NO"),count(distinct
"CARD_NO"),count("MAC_VAL"),count(distinct"MAC_VAL") from
"ACC"."USER_BILLING" sample ( 9.1540402221) t
第二個效能抖動時間點的分析
第二個時間點的分析可以排除後臺job的執行影響,主要的瓶頸還是在於IO
效能問題分析:
The throughput of the I/Osubsystem was significantly lower than expected.
RECOMMENDATION 1: Host Configuration, 30% benefit (2038 seconds)
ACTION: Consider increasing the throughput of the I/O subsystem.
Oracle's recommended solution is to stripe all data file using the
SAME methodology. You might also need to increase the number of disks
for better performance. Alternatively, consider using Oracle's
Automatic Storage Management solution.
RATIONALE: During the analysis period, the average data files' I/O
throughput was 1.8 M persecond for reads and 3.3 M per second for
writes. The average response time for single block reads was 14
milliseconds.
SYMPTOMS THAT LED TO THE FINDING:
SYMPTOM: Wait class "User I/O" was consuming significantdatabase time.
(93% impact [6405 seconds])
改進建議:
開啟非同步IO
目前系統中aio配置存在,但是沒有啟用
$ cat /proc/sys/fs/aio-nr
65536
$ cat/proc/sys/fs/aio-max-nr
65536
$ /usr/bin/ldd $ORACLE_HOME/bin/oracle | greplibaio
libaio.so.1 => /usr/lib64/libaio.so.1 (0x00002af9f4ad8000)
SQL> alter system setfilesystemio_options=setall scope=spfile;
後臺Job的排程
需要進行確認是否可以重新選擇一個低峰時間段來執行Job或者從後臺禁用。按照時間頻率進行統計資訊的收集
SGA元件的調整
從記憶體元件的使用情況來看,shared pool的資源已經被buffer cache進行了壓榨,可以適當調整一下shared pool的大小,比如設定為4G左右,目前僅為1G
內容根據情況看適度做了刪減,可以看出來做一個資料庫巡檢的過程中其實還是需要花費不少的精力來分析問題,找到效能的瓶頸,這也是我們能夠持續改進質量的基線。
來自 “ ITPUB部落格 ” ,連結:http://blog.itpub.net/23718752/viewspace-1767606/,如需轉載,請註明出處,否則將追究法律責任。
相關文章
- 資料庫優化建議資料庫優化
- MySQL資料庫設計規範和優化建議MySql資料庫優化
- ASP.NET程式的優化建議資料庫操作ASP.NET優化資料庫
- MySQL資料庫優化:縮小資料的五點建議VCMySql資料庫優化
- 資料庫查詢和資料庫(MySQL)索引的最佳化建議資料庫MySql索引
- 記一次 Golang 資料庫查詢元件的優化。Golang資料庫元件優化
- 記一次介面效能優化實踐總結:優化介面效能的八個建議優化
- 一次資料庫的優化經歷資料庫優化
- 對SGA和PGA的優化建議優化
- 資料庫的優化和效率資料庫優化
- 2 Day DBA-管理方案物件-監控和優化資料庫-獲取ASMM記憶體尺寸建議物件優化資料庫ASM記憶體
- 記一次資料庫查詢超時優化問題資料庫優化
- 資料遷移中的資料庫檢查和建議資料庫
- MySql資料庫最佳化的幾條核心建議MySql資料庫
- 經營分析資料庫優化方案資料庫優化
- Redis優化建議Redis優化
- EntityFramework 優化建議Framework優化
- Mysql優化建議MySql優化
- 記一次資料庫的優化之隱式轉換的破壞力資料庫優化
- 兩種簡單分析和優化MySQL資料庫表的方法優化MySql資料庫
- .NET程式的效能要領和優化建議優化
- Zabbix 5.0 優化建議優化
- html前端優化建議HTML前端優化
- 頁面優化建議優化
- mysql優化 | 儲存引擎,建表,索引,sql的優化建議MySql優化儲存引擎索引
- 資料庫優化 - SQL優化資料庫優化SQL
- 優化MySQL的21個建議優化MySql
- MySQL資料庫的效能的影響分析及其優化MySql資料庫優化
- SequoiaDB資料庫之建議資料庫
- 資料庫優化資料庫優化
- 分析SQL給出索引優化建議的工具(美團開源)SQL索引優化
- 資料庫的優化需要資料庫優化
- CSS 寫作建議和效能優化小結CSS優化
- 優化 Webpack 構建效能的幾點建議優化Web
- 優化Webpack構建效能的幾點建議優化Web
- 通過重啟資料庫,完成了一次優化資料庫優化
- MySQL 調優/優化的 100 個建議MySql優化
- 淘寶小程式體驗優化:資料分析和優化實踐優化