Traceview是android平臺配備的一個很好的效能分析工具。它可以通過圖形化的方式讓我們瞭解我們要跟蹤的程式的效能,並且能具體到method。
使用Traceview的版本限制
對於Android 1.5及以下的版本:不支援。
對於Android 1.5以上2.1下(含2.1)的版本:受限支援。trace檔案只能生成到SD卡,且必須在程式中加入程式碼。
對於Android 2.2上(含2.2)的版本:全支援。可以不用SD卡,不用在程式中加程式碼,直接自己用DDMS就可以程式Traceview。
一、Android 1.5以上2.1下(含2.1)的版本中Traceview的使用
首先,必須在程式當中加入程式碼,以便生成trace檔案,有了這個trace檔案我們才可以將其轉化為圖形。
1.1、啟動追蹤
使用Debug的以下靜態方法方法來啟動:
static void startMethodTracing(String traceName)
Start method tracing, specifying the trace log file name.
使用指定trace檔案的名字和預設最大容量(8M)的方式開始方法的追蹤
static void startMethodTracing()
Start method tracing with default log name and buffer size.
使用預設trace檔案的名字(dmtrace.trace)和預設最大容量(8M)的方式開始方法的追蹤
static void startMethodTracing(String traceName, int bufferSize, int flags)
Start method tracing, specifying the trace log file name and the buffer size.
使用指定trace檔案的名字和最大容量的方式開始方法的追蹤。並可指定flags.
注:int flags好像沒意義。一般都用0.
static void startMethodTracing(String traceName, int bufferSize)
Start method tracing, specifying the trace log file name and the buffer size.
使用指定trace檔案的名字和最大容量的方式開始方法的追蹤。
注1:以上的方法的檔案都會建立於SD卡下,即"/sdcard/"下,對預設檔名的就是"/sdcard/dmtrace.trace"
如果沒SD卡,以上方法會拋異常致使程式crash.
注2:如果檔名沒有指定型別,系統為其加上型別.trace
1.2、停止追蹤
使用Debug的靜態方法方法來停止:
public static void stopMethodTracing ()。
例如在activity的onCreate()中新增Debug.startMethodTracing(), 而在onDestroy()中新增Debug.stopMethodTracing(),
如下:
@Override
public void onCreate(Bundle savedInstanceState) {
Debug.startMethodTracing();
super.onCreate(savedInstanceState);
..............................
}
protected void onDestroy() {
super.onDestroy();
.................
Debug.stopMethodTracing();
}
對於模擬器我們還得建立一個帶有SD card的AVD,這樣才能使trace檔案儲存到/sdcard/...當中。
可以在命令中分別單獨建立,也可以在建立avd的時候一起將sdcard建立。建立之後通過DDMS file explore我們就可以看到/sdcard/目錄下有一個trace檔案,如果沒有在Debug語句中設定名字則預設為dmtrace.trace.
注意:需要在AndroidManifest.xml檔案中新增android.permission.WRITE_EXTERNAL_STORAGE許可權。
1.3、 把trace檔案從SD卡拷到電腦上
現在我們把這個檔案copy到我們的電腦上指定的目錄:
adb pull /sdcard/dmtrace.trace d:
1.4、啟動traceview可視介面
現在就可以通過命令列來執行traceview了。進入SDK的tools目錄後,執行traceview,如下:
traceview D:\dmtrace.trace.
之後即可以看到圖形介面了。
1.5、分析traceview結果
Timeline Panel
視窗的上半部分是時間軸面圖(Timeline Panel)
The image below shows a close up of the timeline panel. Each thread’s execution is shown in its own row, with time increasing to the right.
Each method is shown in another color (colors are reused in a round-robin fashion starting with the methods that have the most inclusive time).
The thin lines underneath the first row show the extent (entry to exit) of all the calls to the selected method.
介面上方的尺子代表了MethodTracing的時間段(從Debug.startMethodTracing()到Debug.stopMethodTracing()的時間)。
每個執行緒的函式執行時間圖處於和執行緒名同一行的右側。
注1:線寬度代表執行該函式本身操作所用的時間。
注2:函式所呼叫的子函式時間線夾雜在該函式本身操作所用的時間線之間。
注3:時間線的高度不知道有什麼意義。
注4:函式本身是巢狀的。
注5:每行下面粗的線段標註了Profile Panel中被選中函式呼叫所消耗的時間段。每個線段對應一次函式的執行。
在下面的圖中我們可以看到有11次對LoadListener.nativeFinished()的呼叫,其中有一次呼叫耗時特別的多。這裡的11次和圖2並不一致,應該是google的疏忽。
圖1The Traceview Timeline Panel

Profile Panel
視窗的下半介面是對各個函式呼叫的彙總圖Profile Panel
Figure 2 shows the profile pane, a summary of all the time spent in a method.
The table shows both the inclusive and exclusive times (as well as the percentage of the total time).
Exclusive time is the time spent in the method.
Inclusive time is the time spent in the method plus the time spent in any called functions.
We refer to calling methods as "parents" and called methods as "children." When a method is selected (by clicking on it),
it expands to show the parents and children. Parents are shown with a purple background and children with a yellow background.
The last column in the table shows the number of calls to this method plus the number of recursive calls.
The last column shows the number of calls out of the total number of calls made to that method.
In this view, we can see that there were 14 calls to LoadListener.nativeFinished();
looking at the timeline panel shows that one of those calls took an unusually long time.
圖2是對各個函式呼叫的彙總圖Profile Panel。該表給出了the inclusive and exclusive times及他們所佔有的百分比。
Exclusive time是該函式本身基本操作(不包括子函式呼叫)的時間。
Inclusive time是該函式呼叫所用的時間(包括子函式呼叫)的時間。
列1:"Name"表示函式名。
雙擊函式名,可以看到在上半介面是時間軸面圖(Timeline Panel)看他的所消耗的時間段。(用粗的線段標註)。
雙擊函式名左邊的"+"展開後可以看到,該函式的"parents"和"children"
列2:"incl%"表示函式的Inclusive time在整個MethodTracing時間裡佔的百分比。
列3:"Inclusive"表示Inclusive time。
列4:"Excl%"表示函式的Exclusive time在整個MethodTracing時間裡佔的百分比。
列5:"Exclusive"表示Exclusive time。
列6:"Calls+RecurCalls/Total"表示對函式的呼叫次數(包括遞迴呼叫)。如圖2的nativeFinished()那列為"14+0"表示14次非遞迴呼叫,0次遞迴呼叫.
列7:新的版本(比如2.1)還有"time/calls"表示平均的呼叫時間(即Inclusive time/ total calls)。如圖3。來自google文件的圖2感覺有老了。
注:如果函式A呼叫函式B那麼函式A稱為函式B的"parents",函式B稱為函式A的"children."
圖2:Profile Panel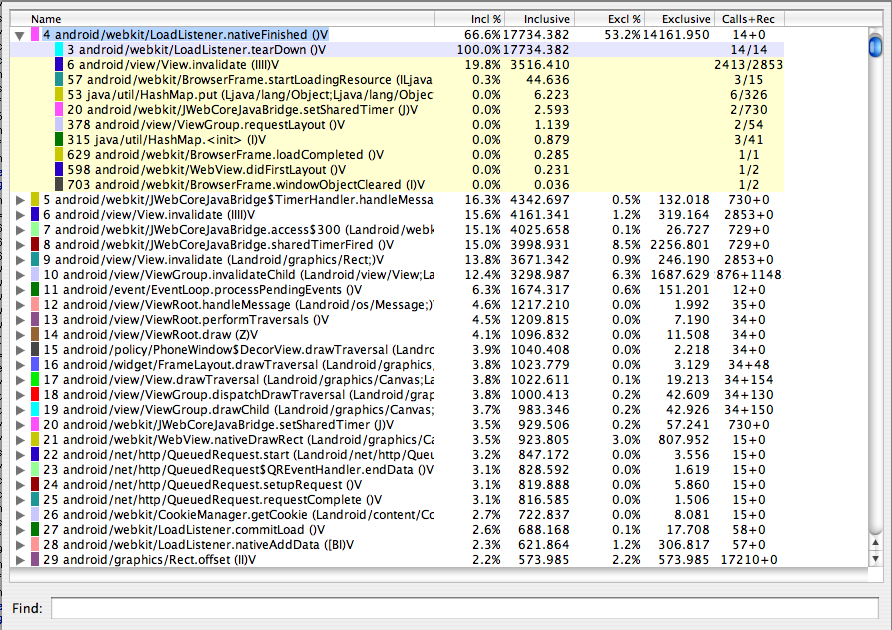
圖3:Profile Panel

二、Android 2.2以上(含2.2)的版本中Traceview的簡化使用。
Android 2.2除了像2.1當中那樣使用Traceview,還可以在DDMS使用Traceview,比以前簡化的不少。
* The trace log files are streamed directly to your development machine.
在Android 2.2後可以不用SD卡。Traceview檔案流是直接指向開發除錯的主機(即DDMS所在的電腦)
To start method profiling:
1. On the Devices tab, select the process that you want to enable method profiling for.
2. Click the Start Method Profiling button.
3. Interact with your application to start the methods that you want to profile.
4. Click the Stop Method Profiling button. DDMS stops profiling your application and opens Traceview with the method profiling information that was collected between the time you clicked on Start Method Profiling and Stop Method Profiling.
在DDMS中如何進行Traceview。
1,在裝置表中選中你想進行method trace的程式。
2,單擊Method Profiling按鈕開始method trace。該按鈕在視窗的左上方,它在"stop"按鈕的左方,"Device選單的正下方"。
3,method trace進行中。
4,單擊Method Profiling按鈕停止method trace。緊接著系統會自動彈出Traceview視窗來顯示剛才的method trace結果。
三、Traceview檔案格式
本文參照來源:
http://wbdban.javaeye.com/blog/564309
http://developer.android.com/guide/developing/debugging/debugging-tracing.html
http://developer.android.com/guide/developing/debugging/ddms.html#profiling