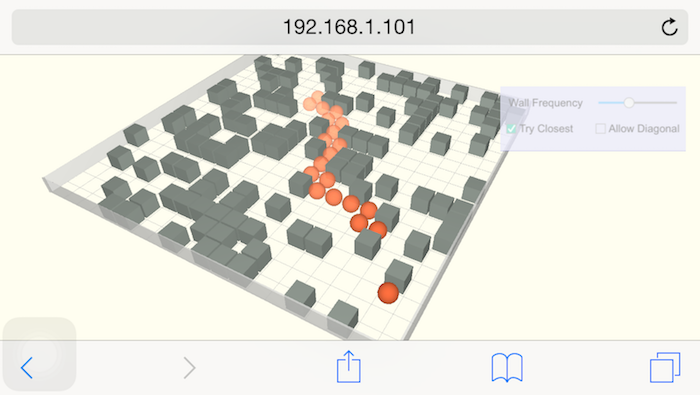
http://www.hightopo.com/demo/astar/astar.html
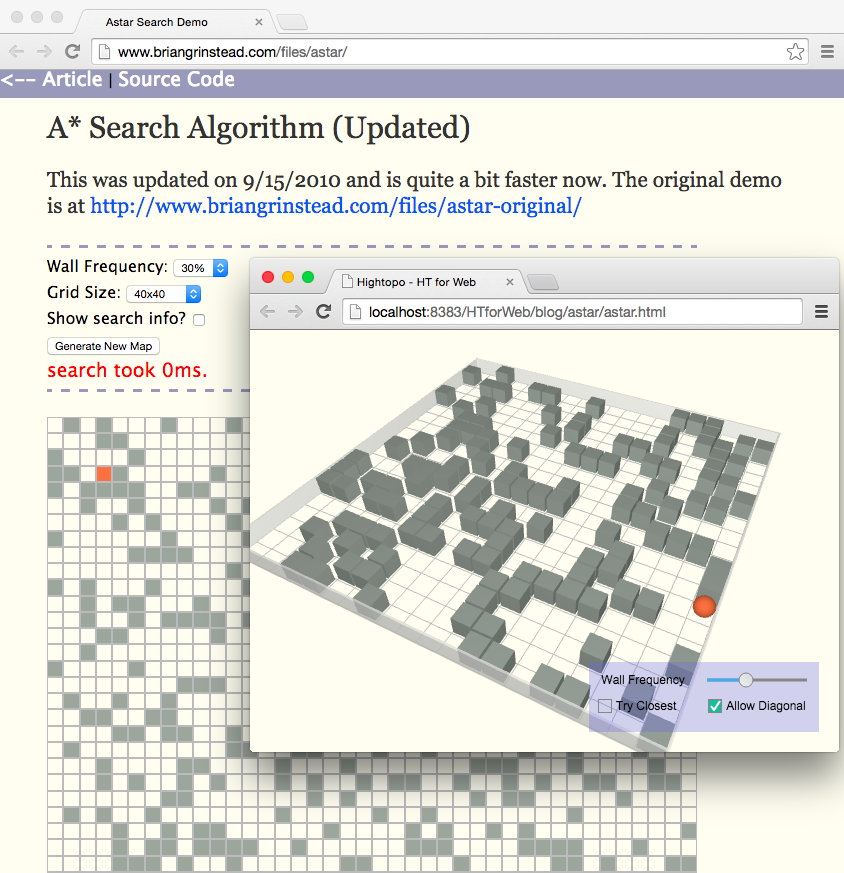
最近搞個遊戲遇到最短路徑的常規遊戲問題,一時起興基於HT for Web寫了個A*演算法的WebGL 3D呈現,演算法基於開源 https://github.com/bgrins/javascript-astar 的javascript實現,其實作者也有個不錯的2D例子實現 http://www.briangrinstead.com/files/astar/ ,只不過覺得所有A*演算法的視覺化實現都是平面的不夠酷,另外還有不少引數需要調節控制,還是值得好好搞個全面的Demo,先上張2D和3D例子的對照圖。
實現程式碼比較容易一百多行,不過演算法核心在astar.js了,介面核心在ht.js裡面了,我只需要構建網格資訊,只需監聽使用者點選,然後呼叫astar.js進行最短路徑計算,將結果通過動畫的方式呈現出走動的過程,所有程式碼如下:
function init() {
    w = 40; m = 20; d = w * m / 2;
    gridRows = [];
    dm = new ht.DataModel();
    g3d = new ht.graph3d.Graph3dView(dm);
    g3d.setGridVisible(true);
    g3d.setGridColor('#BBBBBB');
    g3d.setGridSize(m);
    g3d.setGridGap(w);
    g3d.addToDOM();
    g3d.sm().setSelectionMode('none');
    anim = startBall = endBall = null;
    g3d.getView().addEventListener(ht.Default.isTouchable ? 'touchstart' : 'mousedown', function(e){
        if(!anim){
            var p = g3d.getHitPosition(e);
            var x = Math.floor((p[0] + d)/ w);
            var y = Math.floor((p[2] + d)/ w);
            var endBall = dm.getDataByTag("cell_" + x + "_" + y);
            if(endBall && endBall.s('batch') !== 'wall'){
                if(startBall.a('x') === x && startBall.a('y') === y){
                    return;
                }
                var g = new Graph(gridRows, {
                    diagonal: formPane.v('diagonal')
                });
                var start = g.grid[startBall.a('x')][startBall.a('y')];
                var end = g.grid[x][y];
                var result = astar.search(g, start, end, {
                    closest: formPane.v('closest')
                });
                if(!result.length){
                    return;
                }
                x = result[result.length-1].x;
                y = result[result.length-1].y;
                endBall = dm.getDataByTag("cell_" + x + "_" + y);
                endBall.s('3d.visible', true);
                startBall.s('3d.visible', false);
                formPane.setDisabled(true);
                anim = ht.Default.startAnim({
                    duration: 700,
                    finishFunc: function(){
                        for(var i=0; i<result.length; i++){
                            var ball = dm.getDataByTag("cell_" + result[i].x + "_" + result[i].y);
                            ball.s({
                                '3d.visible': false,
                                'shape3d.opacity': 1,
                                'shape3d.transparent': false
                            });
                            startBall.p3(-d+w*x+w/2, w/2, -d+w*y+w/2);
                            startBall.a({x: x, y: y});
                            startBall.s('3d.visible', true);
                        }
                        anim = null;
                        formPane.setDisabled(false);
                    },
                    action: function(v){
                        var index = Math.round(v*result.length);
                        for(var i=0; i<index; i++){
                            var ball = dm.getDataByTag("cell_" + result[i].x + "_" + result[i].y);
                            ball.s({
                                '3d.visible': true,
                                'shape3d.opacity': i/index*0.3 + 0.7,
                                'shape3d.transparent': true
                            });
                        }
                    }
                });
            }
        }
    }, false);
    createFormPane();
    createGrid();
}
function createGrid(){
    dm.clear();
    var ball;
    gridRows.length = 0;
    for(var x = 0; x < m; x++) {
        var nodeRow = [];
        gridRows.push(nodeRow);
        for(var y = 0; y < m; y++) {
            var isWall = Math.floor(Math.random()*(1/formPane.v('frequency')));
            if(isWall === 0){
                nodeRow.push(0);
                createNode(x, y).s({
                    'batch': 'wall',
                    'all.color': '#9CA69D'
                });
            }else{
                nodeRow.push(1);
                ball = createNode(x, y).s({
                    'shape3d': 'sphere',
                    'shape3d.color': '#FF703F',
                    '3d.visible': false
                });
            }
        }
    }
    if(!ball){
        createGrid();
        return;
    }
    startBall = createNode(ball.a('x'), ball.a('y'), 'start').s({
        'shape3d': 'sphere',
        'shape3d.color': '#FF703F'
    });

    shape = new ht.Shape();
    shape.setPoints(new ht.List([
        {x: -d, y: d},
        {x: d, y: d},
        {x: d, y: -d},
        {x: -d, y: -d},
        {x: -d, y: d}
    ]));
    shape.setThickness(4);
    shape.setTall(w);
    shape.setElevation(w/2);
    shape.setClosePath(true);
    shape.s({
        'all.color': 'rgba(187, 187, 187, 0.8)',
        'all.transparent': true,
        'all.reverse.cull': true
    });
    dm.add(shape);
}
function createNode(x, y, tag){
    var node = new ht.Node();
    tag = tag || "cell_" + x + "_" + y;
    node.setTag(tag);
    node.a({ x: x,  y: y });
    node.s3(w*0.9, w*0.9, w*0.9);
    node.p3(-d+w*x+w/2, w/2, -d+w*y+w/2);
    node.s({
        'all.reverse.cull': true,
        'shape3d.reverse.cull': true
    });
    dm.add(node);
    return node;
}
function createFormPane() {
    formPane = new ht.widget.FormPane();
    formPane.setWidth(230);
    formPane.setHeight(70);
    formPane.getView().className = 'formpane';
    document.body.appendChild(formPane.getView());
    formPane.addRow(['Wall Frequency', {
        id: 'frequency',
        slider: {
            min: 0,
            max: 0.8,
            value: 0.1,
            onValueChanged: function(){
                createGrid();
            }
        }
    }], [100, 0.1]);
    formPane.addRow([
        {
            id: 'closest',
            checkBox: {
                label: 'Try Closest'
            }
        },
        {
            id: 'diagonal',
            checkBox: {
                label: 'Allow Diagonal'
            }
        }
    ], [0.1, 0.1]);
}
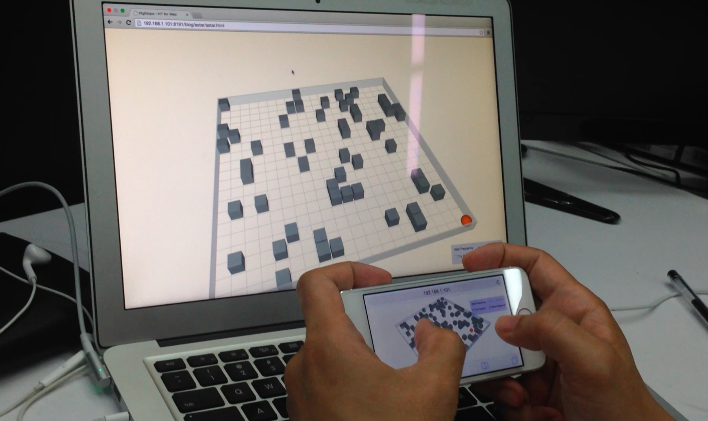
只從iOS8支援WebGL後在移動終端上測試3D應用比當前的大部分Android平板舒服多了,以上的例子在iOS系統下呈現和演算法都挺流暢,http://v.youku.com/v_show/id_XODMzOTU1Njcy.html,當然這個小例子資料量也不大,本質其實還是2D的最短路徑演算法,並非真正意義的3D空間最短路徑,但還是足夠解決很多實際應用問題了。
http://www.hightopo.com/demo/astar/astar.html


