向量Chart圖表嵌入HTML5網路拓撲圖的應用
使用 HT for Web (以下簡稱 HT)開發HTML5網路拓撲圖的開發者有 Chart 需求的專案的時候,感覺很痛苦,HT 整合的 Chart 元件中,並不包含有座標,在展現方面不是很直觀,但是也不是沒有解決方案,接下來我們就來聊聊具體的解決方案。
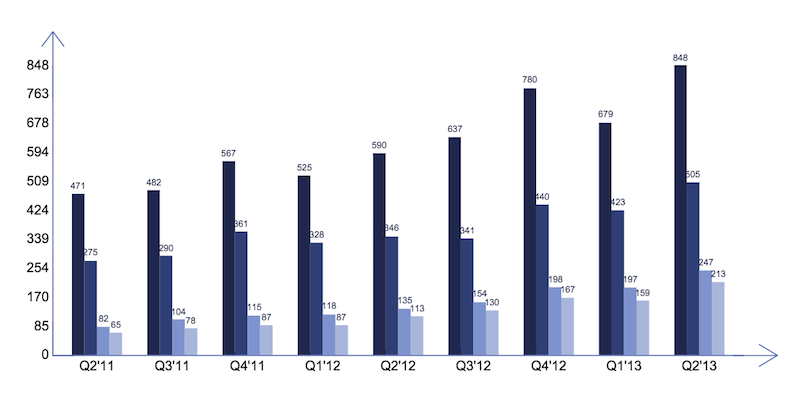
首先,第一種解決方案是,在定義 Chart 向量的時候在 comps 中除了定義 Chart 外,再新增幾個你自定義的繪製區域來繪製你想要的座標軸,效果及 example 如下:

該 Chart 的定義程式碼見附錄1(程式碼的定義太長),程式碼雖然長,但是程式碼的邏輯並不亂,各個模組間的向量描述還是比較清晰的,具體可以參考 HT 的向量手冊,看到如此長的程式碼,我自己都沒信心去維護它,維護這樣的程式碼純粹是體力活,而且複用性也不高,每一個不同的 Chart 都要類似如此地繪製,繪製一兩個這樣的圖表感覺還好,繪製多了,真心會感覺很噁心,再這上面很浪費時間。
其次,第二種解決方案是,通過資料繫結來自定義繪製座標軸。實現以上相同效果,其程式碼見附錄2。可以明顯看出其程式碼量會比第一種解決方案好很多,而且程式碼可以複用。在其他的圖表中,可以將橫軸和縱軸的文字內容設定到 data 的 attr 屬性上,並在定義 chart 時使用上如下程式碼就可以實現座標文字的效果:
ht.Default.setImage(`chartName`, {
    width: Number,
    height: Number,
    comps: [
        {
            // define chart
        },
        {
            type: `xAxis`,
            rect: Array
        },
        {
            type: `yAxis`,
            rect: Array
        }
    ]
});
在這裡我已經通過 ht.Default.setCompType(`typeName`, function(g, rect, comp, data, view){}) 的方法定義了名字為 xAxis 和 yAxis 的 CompType,這兩個 CompType 分別繪製了橫軸和縱軸的座標文字,代替了第一種方案制定多個 CompType 為 text 的寫法,稍微優化了下程式碼,提高程式碼的可維護性。
但是,這樣但使用方法總剛覺有些彆扭,明明座標軸是 Chart 的一部分,在定義 Chart 上卻要硬生生地將圖表和座標部分分開,那如果使用者還要在定義標題、座標刻度、座標說明等需求,那這個方案還是無法爽快的解決大部分通用的需求,需要定義許多 CompType 來渲染不同的需求,而且在使用上也不是那麼爽快。接下來要說明的方案三,就是來解決使用上及維護上的問題。
最後,第三種解決方案是,和第二種解決方案差不多,都是通過 ht.Default.setCompType(`typeName`, function(g, rect, comp, data, view){}) 的方法來定義名字為 axisChart 的 CompType,不同的是,資料並不是設定到 data 中,而是在 ht.Default.setImage() 的 comps 中直接定義其相關屬性。具體的配置屬性說明及其具體的程式碼實現可以檢視附件,使用方式很簡單,在引入 ht.js 核心檔案的前提下,引入附件1的 axisChart.js 檔案即可。
接下來來看下 axisChart 的具體使用及幾個簡單的例子:
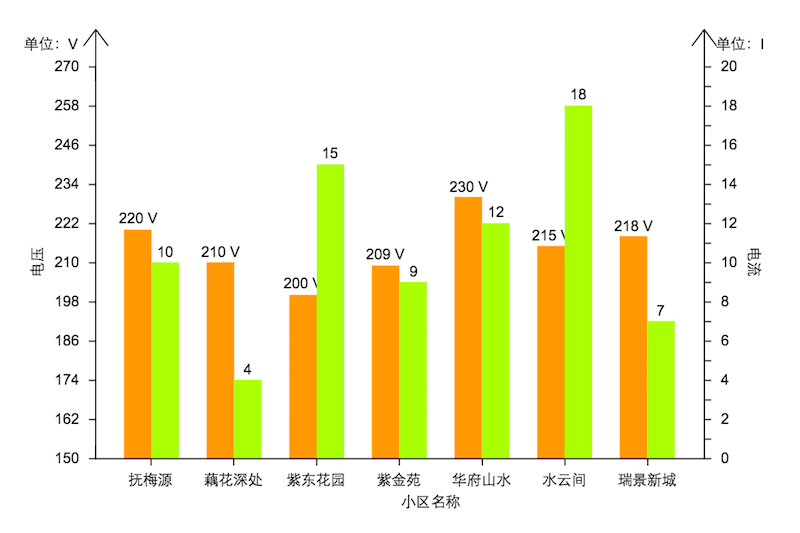
例1:設計同一時刻不同小區之間的電流電壓情況的柱狀圖柱狀圖:

程式碼如下:
ht.Default.setImage(`c1`, {
    width: 600,
    height: 400,
    comps: [
        {
            type: `axisChart`,
            rect: [0, 0, 600, 400],
            yAxis: [
                {
                    name: `單位:V`,
                    max: 270,
                    min: 150,
                    splitNumber: 10,
                    axisTitle: {
                        text: `電壓`,
                        rotate: -90
                    },
                    axisLine: {
                        arrow: true
                    }
                },
                {
                    position: `right`,
                    name: `單位:I`,
                    max: 20,
                    splitNumber: 20,
                    axisTitle: {
                        text: `電流`,
                        rotate: 90
                    },
                    axisLabel: {
                        interval: 1
                    },
                    axisLine: {
                        arrow: true
                    }
                }
            ],
            xAxis: [
                {
                    type: `category`,
                    data: [`撫梅源`, `藕花深處`, `紫東花園`, `紫金苑`, `華府山水`, `水雲間`, `瑞景新城`],
                    axisTitle: {
                        text: `小區名稱`
                    }
                }
            ],
            series: [
                {
                    label: function(value){
                        return value + ` V`;
                    },
                    data: {
                        values: [220, 210, 200, 209, 230, 215, 218],
                        color: `#f90`
                    }
                },
                {
                    yAxisPosition: `right`,
                    label: true,
                    data: {
                        values: [10, 4, 15, 9, 12, 18, 7],
                        color: `#af0`
                    }
                }
            ]
        }
    ]
});
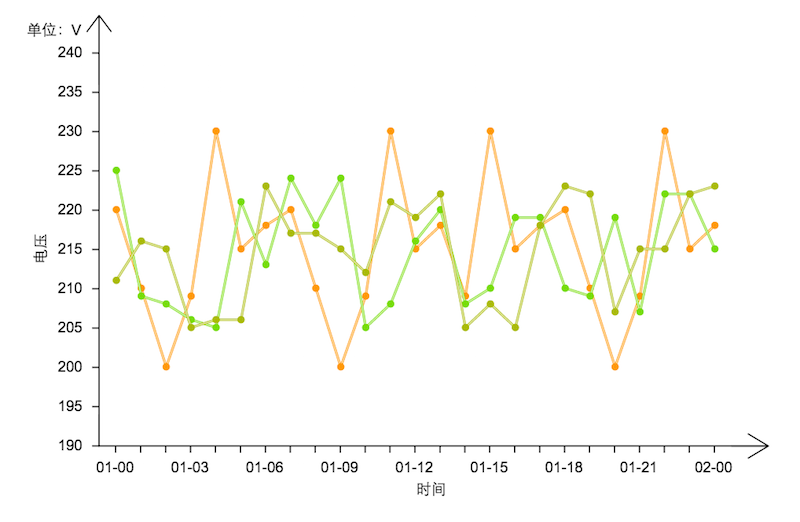
例2: 不同時刻,不同小區的電壓情況的折線圖:

程式碼如下:
ht.Default.setImage(`c2`, {
    width: 600,
    height: 400,
    comps: [
        {
            type: `axisChart`,
            rect: [0, 0, 600, 400],
            yAxis: [
                {
                    name: `單位:V`,
                    max: 240,
                    min: 190,
                    splitNumber: 10,
                    axisTitle: {
                        text: `電壓`,
                        rotate: -90
                    },
                    axisLine: {
                        arrow: true
                    }
                }
            ],
            xAxis: [
                {
                    type: `time`,
                    min: new Date(2015, 0, 1),
                    max: new Date(2015, 0, 2),
                    splitNumber: 25,
                    axisTitle: {
                        text: `時間`
                    },
                    axisLabel: {
                        interval: 2,
                        formatter: function(value, index, min, max){
                            return value.format(`dd-hh`);
                        }
                    },
                    axisLine: {
                        arrow: true
                    }
                }
            ],
            series: [
                {
                    type: `line`,
                    data: {
                        values: [220, 210, 200, 209, 230, 215, 218, 220, 210, 200, 209, 230, 215, 218, 209, 230, 215, 218, 220, 210, 200, 209, 230, 215, 218],
                        color: `#f90`
                    }
                },
                {
                    type: `line`,
                    data: {
                        values: [225, 209, 208, 206, 205, 221, 213, 224, 218, 224, 205, 208, 216, 220, 208, 210, 219, 219, 210, 209, 219, 207, 222, 222, 215],
                        color: `#7d0`
                    }
                },
                {
                    type: `line`,
                    linePoint: true,
                    line3d: true,
                    data: {
                        values: [211, 216, 215, 205, 206, 206, 223, 217, 217, 215, 212, 221, 219, 222, 205, 208, 205, 218, 223, 222, 207, 215, 215, 222, 223],
                        color: `#ab0`
                    }
                }
            ]
        }
    ]
});
最後,還有一點要說明,axisChart 的程式碼並不是那麼的無懈可擊,我個人覺得程式碼設計上還是有些欠缺,所有的程式碼總共有差不多 1000 行,我覺得太臃腫了,在設計上自己也感覺不是那麼的友好,等想修改的時候發現已經投入太多時間了,還有好多事情等待著我我去學習、去探討,所以也就線這樣吧,等有空了再重構一番,但是我相信在功能上還是能夠滿足大部分的需求,在設計上,或者是實現的方法上,還是在使用過程中發現的 bug,還望大家能夠不吝賜教。
附錄1
ht.Default.setImage(`chart`, {
    width: 650,
    height: 380,
    comps: [
        // column chart
        {
            type: `columnChart`,
            rect: [10, 60, 630, 260],
            label: true,
            labelColor: `#20284C`,
            labelFont: `8px Arial`,
            series: [
                {
                    color: `#20284C`,
                    values: [471, 482, 567, 525, 590, 637, 780, 679, 848]
                },
                {
                    color: `#303F74`,
                    values: [275, 290, 361, 328, 346, 341, 440, 423, 505]
                },
                {
                    color: `#7E93CD`,
                    values: [82, 104, 115, 118, 135, 154, 198, 197, 247]
                },
                {
                    color: `#A9B6DB`,
                    values: [65, 78, 87, 87, 113, 130, 167, 159, 213]
                }
            ]
        },
        // 豎線
        {
            type: `rect`,
            rect: [15, 60, 1, 260],
            background: `#566CB0`
        },
        {
            type: `shape`,
            rect: [5.5, 30, 20, 30],
            borderWidth: 1,
            borderColor: `#566CB0`,
            points: [0, 20 / 3 * 2, 20 / 2, 0, 20, 20 / 3 * 2, 20 / 2, 0, 20 / 2, 30],
            segments: [1, 2, 2, 1, 2]
        },
        // 座標文字
        {
            type: `text`,
            rect: [0, 320 - 26 * 10 - 8, 15, 16],
            align: `right`,
            text: Math.round(84.8 * 10)
        },
        {
            type: `text`,
            rect: [0, 320 - 26 * 9 - 8, 15, 16],
            align: `right`,
            text: Math.round(84.8 * 9)
        },
        {
            type: `text`,
            rect: [0, 320 - 26 * 8 - 8, 15, 16],
            align: `right`,
            text: Math.round(84.8 * 8)
        },
        {
            type: `text`,
            rect: [0, 320 - 26 * 7 - 8, 15, 16],
            align: `right`,
            text: Math.round(84.8 * 7)
        },
        {
            type: `text`,
            rect: [0, 320 - 26 * 6 - 8, 15, 16],
            align: `right`,
            text: Math.round(84.8 * 6)
        },
        {
            type: `text`,
            rect: [0, 320 - 26 * 5 - 8, 15, 16],
            align: `right`,
            text: Math.round(84.8 * 5)
        },
        {
            type: `text`,
            rect: [0, 320 - 26 * 4 - 8, 15, 16],
            align: `right`,
            text: Math.round(84.8 * 4)
        },
        {
            type: `text`,
            rect: [0, 320 - 26 * 3 - 8, 15, 16],
            align: `right`,
            text: Math.round(84.8 * 3)
        },
        {
            type: `text`,
            rect: [0, 320 - 26 * 2 - 8, 15, 16],
            align: `right`,
            text: Math.round(84.8 * 2)
        },
        {
            type: `text`,
            rect: [0, 320 - 26 * 1 - 8, 15, 16],
            align: `right`,
            text: Math.round(84.8 * 1)
        },
        {
            type: `text`,
            rect: [0, 320 - 8, 15, 16],
            align: `right`,
            text: 0
        },
        // Q
        {
            type: `text`,
            rect: [55, 322, 0, 16],
            align: `center`,
            text: `Q2`11`
        },
        {
            type: `text`,
            rect: [124, 322, 0, 16],
            align: `center`,
            text: `Q3`11`
        },
        {
            type: `text`,
            rect: [191, 322, 0, 16],
            align: `center`,
            text: `Q4`11`
        },
        {
            type: `text`,
            rect: [259, 322, 0, 16],
            align: `center`,
            text: `Q1`12`
        },
        {
            type: `text`,
            rect: [327, 322, 0, 16],
            align: `center`,
            text: `Q2`12`
        },
        {
            type: `text`,
            rect: [394, 322, 0, 16],
            align: `center`,
            text: `Q3`12`
        },
        {
            type: `text`,
            rect: [462, 322, 0, 16],
            align: `center`,
            text: `Q4`12`
        },
        {
            type: `text`,
            rect: [529, 322, 0, 16],
            align: `center`,
            text: `Q1`13`
        },
        {
            type: `text`,
            rect: [596, 322, 0, 16],
            align: `center`,
            text: `Q2`13`
        },
        // line
        {
            type: `rect`,
            rect: [15, 320, 620, 1],
            background: `#566CB0`
        },
        {
            type: `shape`,
            rect: [635, 310.5, 30, 20],
            borderWidth: 1,
            borderColor: `#566CB0`,
            points: [20 / 3 * 2, 0, 30, 20 / 2, 20 / 3 * 2, 20, 30, 20 / 2, 0, 20 / 2],
            segments: [1, 2, 2, 1, 2]
        }
    ]
});
附錄2
ht.Default.setCompType(`yAxis`, function(g, rect, comp, data, view) {
    var labels = data.a(`yLabels`),
            len = labels.length,
            x = rect.x,
            y = rect.y,
            w = rect.width,
            h = rect.height,
            dh = h / (len - 1);
    g.save();
    g.font = `12px arial, sans-serif`;
    g.fillStyle = `black`;
    g.textAlign = `right`;
    for(var i = 0; i < len; i++){
        g.fillText(labels[i], x, y);
        y += dh;
    }
    g.restore();
});

ht.Default.setCompType(`xAxis`, function(g, rect, comp, data, view) {
    var labels = data.a(`xLabels`),
            len = labels.length,
            x = rect.x,
            y = rect.y,
            w = rect.width,
            h = rect.height,
            dw = w / (len * 3 + 1),
            dw3 = 3 * dw;
    x += dw * 2;
    g.save();
    g.font = `12px arial, sans-serif`;
    g.fillStyle = `black`;
    g.textAlign = `center`;
    for(var i = 0; i < len; i++){
        g.fillText(labels[i], x, y);
        x += dw3;
    }
    g.restore();
});

ht.Default.setImage(`chart1`, {
    width: 650,
    height: 380,
    comps: [
        // column chart
        {
            type: `columnChart`,
            rect: [10, 60, 630, 260],
            label: true,
            labelColor: `#20284C`,
            labelFont: `8px Arial`,
            series: [
                {
                    color: `#20284C`,
                    values: [471, 482, 567, 525, 590, 637, 780, 679, 848]
                },
                {
                    color: `#303F74`,
                    values: [275, 290, 361, 328, 346, 341, 440, 423, 505]
                },
                {
                    color: `#7E93CD`,
                    values: [82, 104, 115, 118, 135, 154, 198, 197, 247]
                },
                {
                    color: `#A9B6DB`,
                    values: [65, 78, 87, 87, 113, 130, 167, 159, 213]
                }
            ]
        },
        // 豎線
        {
            type: `rect`,
            rect: [15, 60, 1, 260],
            background: `#566CB0`
        },
        // 向上的箭頭
        {
            type: `shape`,
            rect: [5.5, 30, 20, 30],
            borderWidth: 1,
            borderColor: `#566CB0`,
            points: [0, 20 / 3 * 2, 20 / 2, 0, 20, 20 / 3 * 2, 20 / 2, 0, 20 / 2, 30],
            segments: [1, 2, 2, 1, 2]
        },
        // 座標文字
        {
            type: `yAxis`,
            rect: [12, 60, 15, 260]
        },
        // Q
        {
            type: `xAxis`,
            rect: [10, 330, 630, 16]
        },
        // line
        {
            type: `rect`,
            rect: [15, 320, 620, 1],
            background: `#566CB0`
        },
        // 向右的箭頭
        {
            type: `shape`,
            rect: [635, 310.5, 30, 20],
            borderWidth: 1,
            borderColor: `#566CB0`,
            points: [20 / 3 * 2, 0, 30, 20 / 2, 20 / 3 * 2, 20, 30, 20 / 2, 0, 20 / 2],
            segments: [1, 2, 2, 1, 2]
        }
    ]
});
相關文章
- HTML5 網路拓撲圖整合 OpenLayers 實現 GIS 地圖應用HTML地圖
- 快速開發基於 HTML5 網路拓撲圖應用HTML
- 網路拓撲圖上文字的巧妙應用
- 快速開發基於 HTML5 網路拓撲圖應用1HTML
- ECharts整合HT for Web的網路拓撲圖應用EchartsWeb
- HTML5 網路拓撲圖效能優化HTML優化
- 網路拓撲圖:網路拓撲圖介紹及線上製作
- 向量化的HTML5拓撲圖形元件設計HTML元件
- ECharts+百度地圖網路拓撲圖應用Echarts地圖
- ECharts+BaiduMap+HT for Web網路拓撲圖應用EchartsAIWeb
- 快速建立 HTML5 Canvas 電信網路拓撲圖HTMLCanvas
- HTML5 電信網路拓撲圖效能優化HTML優化
- 百度地圖、ECharts整合HT for Web網路拓撲圖應用地圖EchartsWeb
- 快速開發基於 HTML5 網路拓撲圖應用--入門篇(一)HTML
- 快速開發基於 HTML5 網路拓撲圖應用--入門篇(二)HTML
- 基於 HTML5 WebGL 的 3D 網路拓撲圖HTMLWeb3D
- 基於 WebGL 的 HTML5 3D 網路拓撲圖WebHTML3D
- 基於 HTML5 Canvas 電信網路拓撲圖的快速搭建HTMLCanvas
- 基於 HTML5 Canvas 繪製的電信網路拓撲圖HTMLCanvas
- 基於 WebGL 的 HTML5 網路拓撲結構 3D 圖WebHTML3D
- 基於 HTML5 WebGL 的 3D 網路拓撲結構圖HTMLWeb3D
- 百度地圖與HT for Web結合的GIS網路拓撲應用地圖Web
- 基於 HTML5 的網路拓撲圖之 DataBinding 資料繫結HTML
- 電信網路拓撲圖自動佈局
- 基於 HTML5 網路拓撲圖的快速開發之入門篇(二)HTML
- 基於 HTML5 網路拓撲圖的快速開發之入門篇(一)HTML
- 快速開發基於 HTML5 網路拓撲圖應用之 DataBinding 資料繫結篇HTML
- 網站拓撲圖(來自qq)網站
- 圖論——拓撲排序圖論排序
- HTML5拓撲圖形元件設計之道(一)HTML元件
- 基於 HTML5 Canvas 的拓撲元件 ToolTip 應用HTMLCanvas元件
- 圖(3)--拓撲排序與關鍵路徑排序
- Reward (圖論+拓撲排序)圖論排序
- 數百個 HTML5 例子學習 HT 圖形元件 – 拓撲圖篇HTML元件
- 網路基本認知(2)--網路拓撲圖的規劃與設計
- iOS平臺快速釋出HT for Web拓撲圖APP應用iOSWebAPP
- 有向圖的拓撲排序——DFS排序
- 網路拓撲結構