熵描述了事物的混亂程度
一個變數x,它的可取值為x1,x2,x3,x4.當它取值為這幾個值時,概率分別為p1,p2,p3,p4.那麼這個混亂程度就可以描述為f(p1,p2,p3,p4).
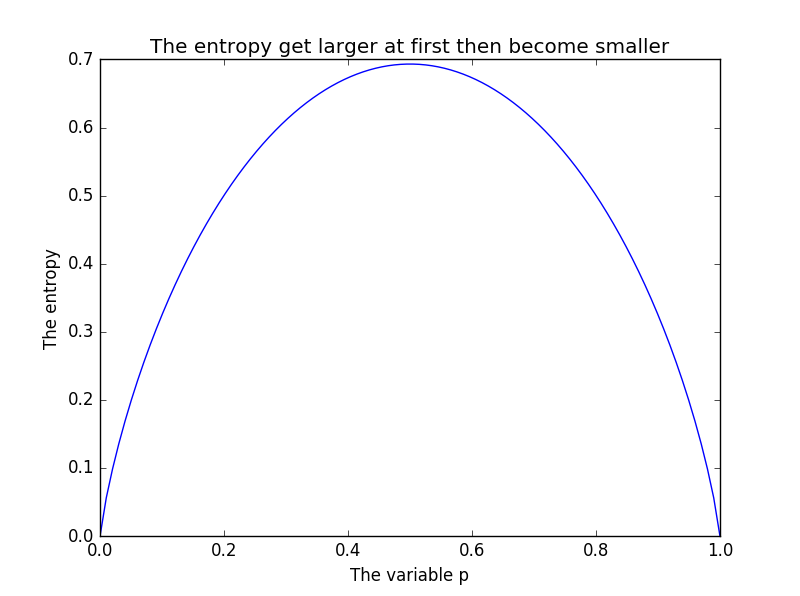
二元取值時熵隨p1的變化
隨著可取值個數的增加,熵的最大值逐漸增大
熵的最大值在各個變數概率相等的情況下取得,也就是說,越是等概率的取值,混亂程度越大.f(x)=x*[-(1/x)*ln(1/x)]=-ln(1/x)=ln(x)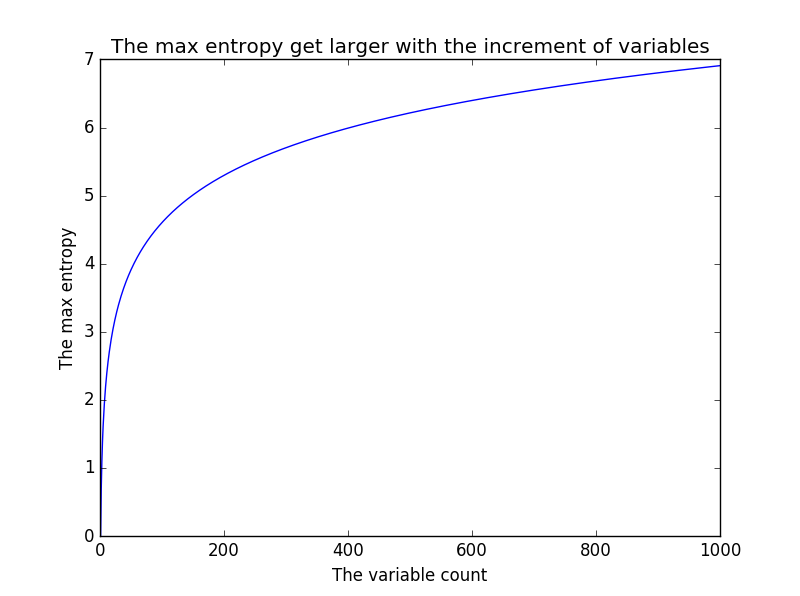
熵的另一種描述----基尼係數
基尼係數定義為:對於變數x,取兩次,得到x1和x2,他們不相等的概率就是系統的熵!
多麼簡潔明瞭的定義,從概率的角度出發進行定義熵。
和夏農熵一樣,基尼係數也描述了系統的混亂程度。
那麼基尼係數如何計算呢?用逆向思維:求x1=x2的概率,即p1^2+p2^2+p3^2。。。,基尼係數=1-p(x1=x2)=1-p1*p1-p2*p2-p3*p3。
很容易想到,基尼係數的影象類似二次函式的影象。
畫出上面兩幅圖的程式碼
import matplotlib.pyplot as plt
import numpy as np
import math

x = np.linspace(0.00001, 0.999999, 100)
y = -(x * np.log(x) + (1 - x) * np.log(1 - x))
plt.plot(x, y)
plt.title('The entropy get larger at first then become smaller')
plt.xlabel('The variable p')
plt.ylabel('The entropy')
plt.show()

varCount=1000
vars=list(range(1,varCount))
maxEntropy = [i * (-1 / i * math.log(1 / i)) for i in vars]
plt.plot(vars,maxEntropy)
plt.title("The max entropy get larger with the increment of variables")
plt.xlabel("The variable count")
plt.ylabel("The max entropy")
plt.show()